


 本文介绍了OpenCV中使用Hough变换进行直线检测的原理和步骤,包括从理论到实际应用的详细解释。通过读取图像、边缘检测、应用HoughLineTransform和ProbabilisticHoughLineTransform,最终在图像上绘制检测到的直线。示例代码展示了如何在Python中实现这一过程。
Python+OpenCV:Hough直线检测(Hough Line Transform)
理论
A line can be represented as ![]() or in a parametric form, as
or in a parametric form, as ![]() where ρ is the perpendicular distance(垂直距离) from the origin to the line,
where ρ is the perpendicular distance(垂直距离) from the origin to the line,
and θ is the angle formed by this perpendicular line and the horizontal axis measured in counter-clockwise (That direction varies on how you represent the coordinate system.
This representation is used in OpenCV). Check the image below:
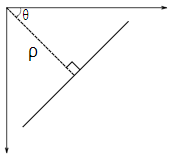
So if the line is passing below the origin, it will have a positive rho and an angle less than 180.
If it is going above the origin, instead of taking an angle greater than 180, the angle is taken less than 180, and rho is taken negative.
Any vertical line will have 0 degree and horizontal lines will have 90 degree.
Now let's see how the Hough Transform works for lines.
Any line can be represented in these two terms, (ρ,θ).
So first it creates a 2D array or accumulator (to hold the values of the two parameters) and it is set to 0 initially.
Let rows denote the ρ and columns denote the θ.
Size of array depends on the accuracy you need.
Suppose you want the accuracy of angles to be 1 degree, you will need 180 columns.
For ρ, the maximum distance possible is the diagonal length of the image.
So taking one pixel accuracy, the number of rows can be the diagonal length of the image.
Consider a 100x100 image with a horizontal line at the middle.
Take the first point of the line. You know its (x,y) values.
Now in the line equation, put the values θ=0,1,2,....,180 and check the ρ you get.
For every (ρ,θ) pair, you increment value by one in our accumulator in its corresponding (ρ,θ) cells.
So now in accumulator, the cell (50,90) = 1 along with some other cells.
Now take the second point on the line.
Do the same as above. Increment the values in the cells corresponding to (rho, theta) you got.
This time, the cell (50,90) = 2. What you actually do is voting the (ρ,θ) values.
You continue this process for every point on the line.
At each point, the cell (50,90) will be incremented or voted up, while other cells may or may not be voted up.
This way, at the end, the cell (50,90) will have maximum votes.
So if you search the accumulator for maximum votes, you get the value (50,90) which says, there is a line in this image at a distance 50 from the origin and at angle 90 degrees.
It is well shown in the below animation (Image Courtesy: Amos Storkey )
This is how hough transform works for lines. It is simple, and may be you can implement it using Numpy on your own. Below is an image which shows the accumulator. Bright spots at some locations denote they are the parameters of possible lines in the image. (Image courtesy: Wikipedia )

Hough Transform in OpenCV
####################################################################################################
# Hough直线检测(Hough Line Transform)
def lmc_cv_image_hough_line_transform():
    """
        函数功能: Hough直线检测(Hough Line Transform)。
    """

    # 读取图像
    image = lmc_cv.imread('D:/99-Research/Python/Image/football_field.jpg', flags=lmc_cv.IMREAD_UNCHANGED)
    rgb_image1 = lmc_cv.cvtColor(image, lmc_cv.COLOR_BGR2RGB)
    rgb_image2 = rgb_image1.copy()
    gray_image = lmc_cv.cvtColor(rgb_image1, lmc_cv.COLOR_RGB2GRAY)
    pyplot.figure('Image Display')
    pyplot.subplot(2, 2, 1)
    pyplot.imshow(rgb_image1, cmap='gray')
    pyplot.title('Original Image')
    pyplot.xticks([])
    pyplot.yticks([])

    # 边缘检测
    ret, thresh_image = lmc_cv.threshold(gray_image, 160, 255, lmc_cv.THRESH_BINARY)
    edges_image = lmc_cv.Canny(thresh_image, 50, 250, apertureSize=3)
    pyplot.subplot(2, 2, 2)
    pyplot.imshow(edges_image, cmap='gray')
    pyplot.title('Edges Image')
    pyplot.xticks([])
    pyplot.yticks([])

    # Hough直线检测(Hough Line Transform)
    lines = lmc_cv.HoughLines(edges_image, rho=3, theta=np.pi / 90, threshold=300)
    for line in lines:
        rho, theta = line[0]
        a = np.cos(theta)
        b = np.sin(theta)
        x0 = a * rho
        y0 = b * rho
        x1 = int(x0 + 1000 * (-b))
        y1 = int(y0 + 1000 * a)
        x2 = int(x0 - 1000 * (-b))
        y2 = int(y0 - 1000 * a)
        lmc_cv.line(rgb_image1, (x1, y1), (x2, y2), (255, 0, 0), 2)
    pyplot.subplot(2, 2, 3)
    pyplot.imshow(rgb_image1, cmap='gray')
    pyplot.title('Hough Transform Image')
    pyplot.xticks([])
    pyplot.yticks([])

    # 概率Hough直线检测(Probabilistic Hough Line Transform)
    probabilistic_lines = lmc_cv.HoughLinesP(edges_image, rho=3, theta=np.pi / 180, threshold=100, minLineLength=100,
                                             maxLineGap=10)
    for line in probabilistic_lines:
        x1, y1, x2, y2 = line[0]
        lmc_cv.line(rgb_image2, (x1, y1), (x2, y2), (0, 0, 255), 2)
    pyplot.subplot(2, 2, 4)
    pyplot.imshow(rgb_image2, cmap='gray')
    pyplot.title('Probabilistic Hough Transform Image')
    pyplot.xticks([])
    pyplot.yticks([])

    # 根据用户输入保存图像
    if ord("q") == (lmc_cv.waitKey(0) & 0xFF):
        # 销毁窗口
        pyplot.close('all')
    return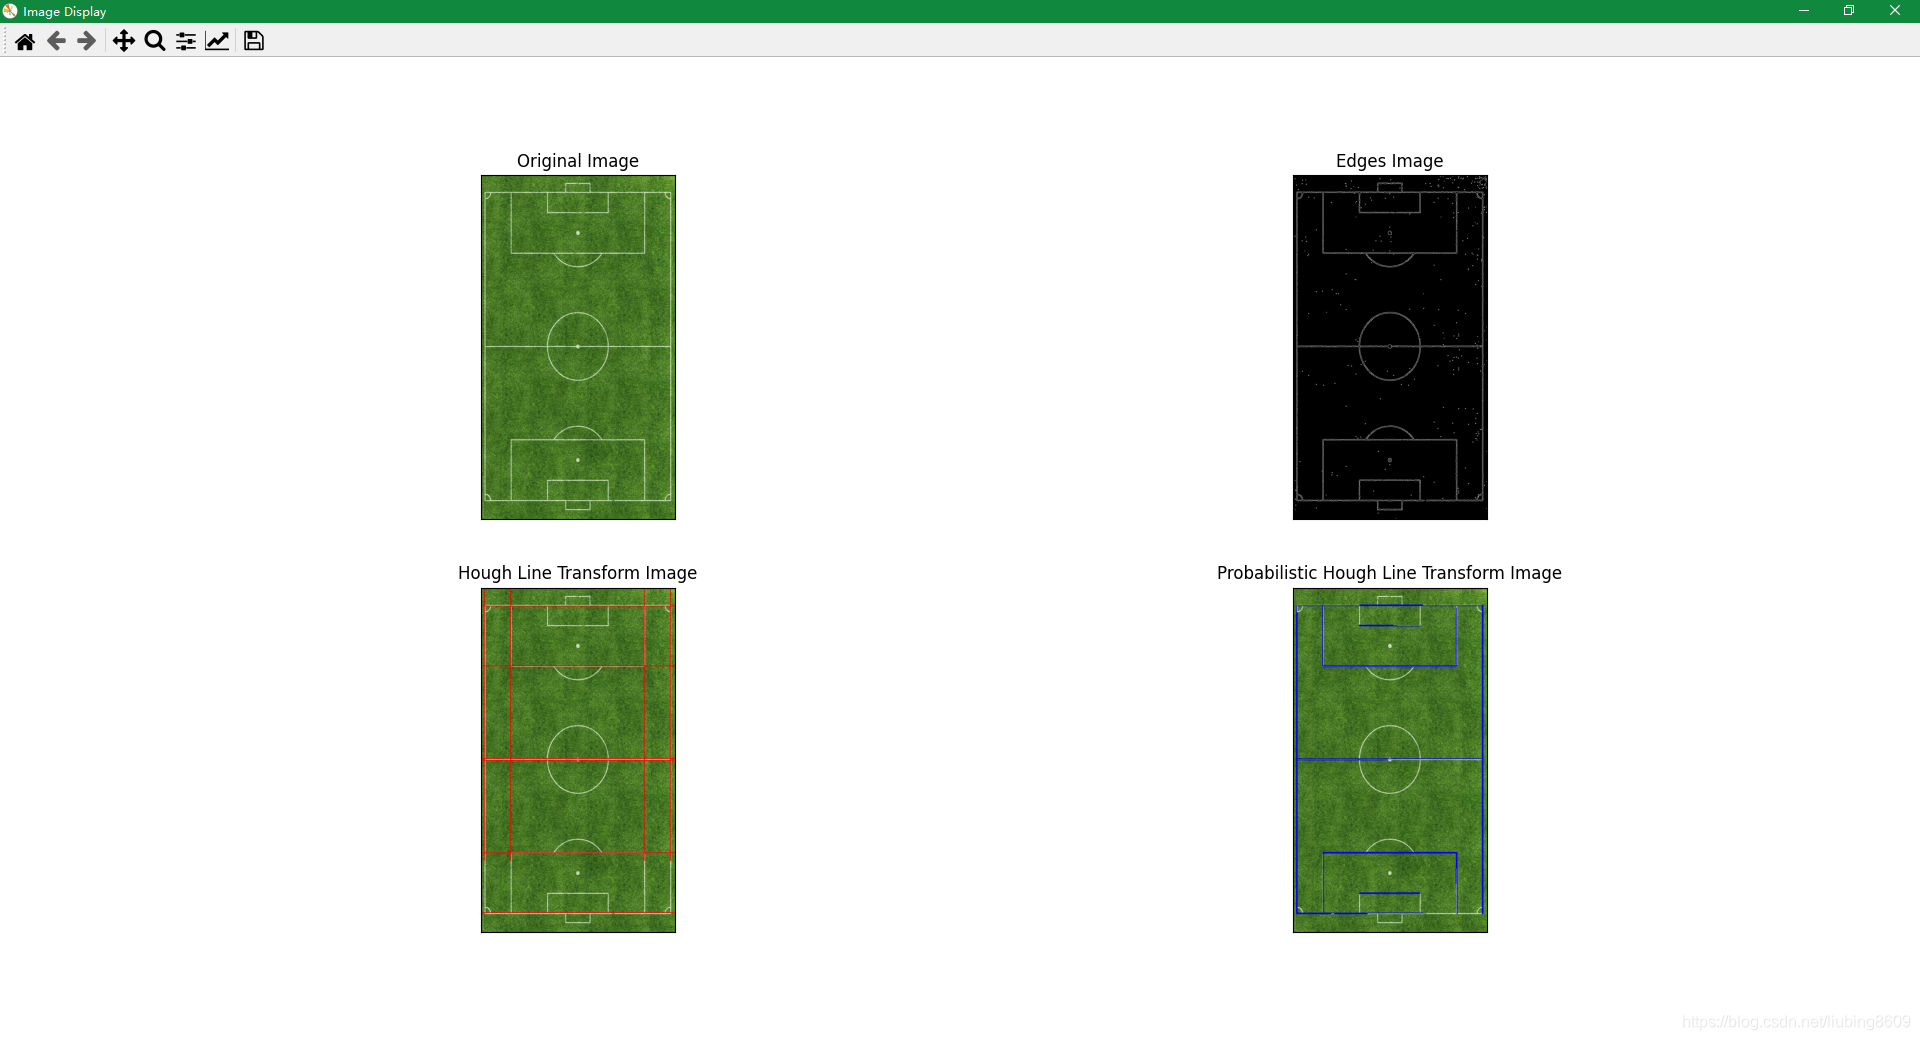


 被折叠的 条评论
为什么被折叠?
被折叠的 条评论
为什么被折叠?
 到【灌水乐园】发言


