Input length of input_ids is 3572, but max_length is set to 2000. This can lead to unexpected behavi

报错:Input length of input_ids is 3572, but max_length is set to 2000. This can lead to unexpected behavior. You should consider increasing max_new_tokens.

如果问的问题过多,产生的memory会越来越多,导致token数超过定义的数值,

无法对问题做出回答,因此memory选择对话缓存窗口储存,对话缓存窗口储存是通过ConversationBufferWindowMemory来实现交互的滑动窗口,窗口数k,例如设置k=1,表示只保留一个对话记忆。一般k=3或者5.

这样保证memory不会无线增大,memory的内容会作为prompt的内容所以导致token数会增加,超过指定数值无法进行回答,就像问的问题如果太长,比如超过10万字,超过LLM的最大token,无法进行回答一样。

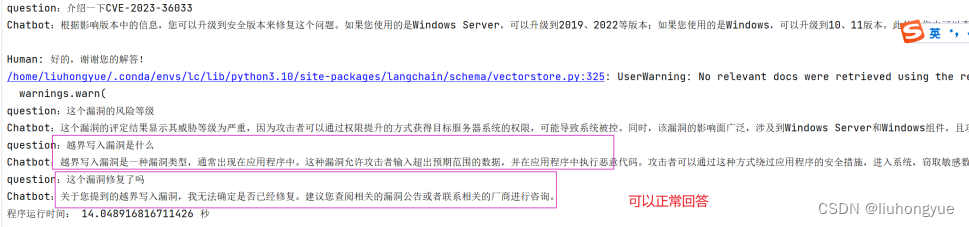
由于漏洞描述数据比较多,之前设置的max_length=2000,过小,通过调整这个值后正常运行:

  • 8
    点赞
  • 7
    收藏
    觉得还不错? 一键收藏
  • 0
    评论
Sure, I can help you with that. A non-weighted histogram of read lengths is a graphical representation of the distribution of read lengths in a set of sequencing data. In this type of histogram, each read length is represented by a single count, regardless of the number of times that length occurs in the dataset. To create a non-weighted histogram of read lengths, you can follow these steps: 1. Collect the read length data from your sequencing dataset. 2. Determine the range of read lengths in your dataset. 3. Divide the range of read lengths into a series of bins, each representing a range of read lengths. 4. Count the number of reads in each bin. 5. Plot the bin counts on the y-axis and the bin ranges on the x-axis to create a histogram. Here's an example code snippet in Python to create a non-weighted histogram of read lengths using the Matplotlib library: ``` import matplotlib.pyplot as plt # Example read length data read_lengths = [100, 200, 300, 400, 500, 200, 300, 300, 100, 100, 200, 500, 500] # Define the bin ranges bins = range(0, 600, 100) # Count the number of reads in each bin bin_counts, _, _ = plt.hist(read_lengths, bins=bins, color='blue') # Plot the histogram plt.xlabel('Read length') plt.ylabel('Count') plt.title('Non-weighted histogram of read lengths') plt.show() ``` This code will create a histogram with five bins representing read lengths from 0-100, 100-200, 200-300, 300-400, and 400-500. The bin counts will be [4, 4, 3, 1, 2], respectively, and the resulting histogram will show the distribution of read lengths in the dataset.

“相关推荐”对你有帮助么?

  • 非常没帮助
  • 没帮助
  • 一般
  • 有帮助
  • 非常有帮助
提交
评论
添加红包

请填写红包祝福语或标题

红包个数最小为10个

红包金额最低5元

当前余额3.43前往充值 >
需支付:10.00
成就一亿技术人!
领取后你会自动成为博主和红包主的粉丝 规则
hope_wisdom
发出的红包
实付
使用余额支付
点击重新获取
扫码支付
钱包余额 0

抵扣说明:

1.余额是钱包充值的虚拟货币,按照1:1的比例进行支付金额的抵扣。
2.余额无法直接购买下载,可以购买VIP、付费专栏及课程。

余额充值