


学习,matplotlib模块的绘图功能。
主要参考于博客:http://blog.csdn.net/ali197294332/article/details/51694141
具体模块导入在最后第7部分汇总代码中给出。
1、绘制基本图像
def initial_image():

    # define x\y
    x = np.arange(0.0, 2.0, 0.05)
    s = np.sin(np.pi * x)

    # set color and linestyle
    plt.plot(x, s, "yo-")

    # set tilte and x\y labels
    plt.title("it's just a test")
    plt.xlabel("x-label")
    plt.ylabel("y-label")

    plt.grid() # set gridding
    plt.savefig("initial_img.png") # save image
    plt.show() # show the image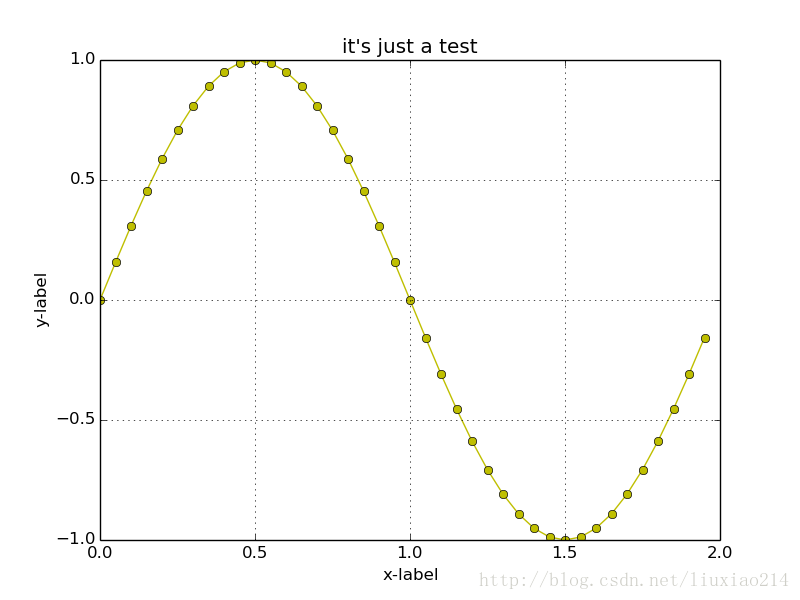
2、一张图中绘制多张图像
def two_images():

    x = np.arange(0.0, 2.0, 0.1)
    s1 = np.sin(np.pi * x)
    s2 = x * 2

    plt.subplot(2, 1, 1) # devide 2 rows and 1 cols and get first row
    plt.plot(x, s1, "yo-")
    plt.title("it's a two_imgs demo")
    plt.xlabel("xx1")
    plt.ylabel("yy1")
    plt.grid()

    plt.subplot(2, 1, 2)
    plt.plot(x, s2, "r.-")
    plt.xlabel("xx2")
    plt.ylabel("yy2")
    plt.grid()
    plt.savefig("two_images.png")
    plt.show()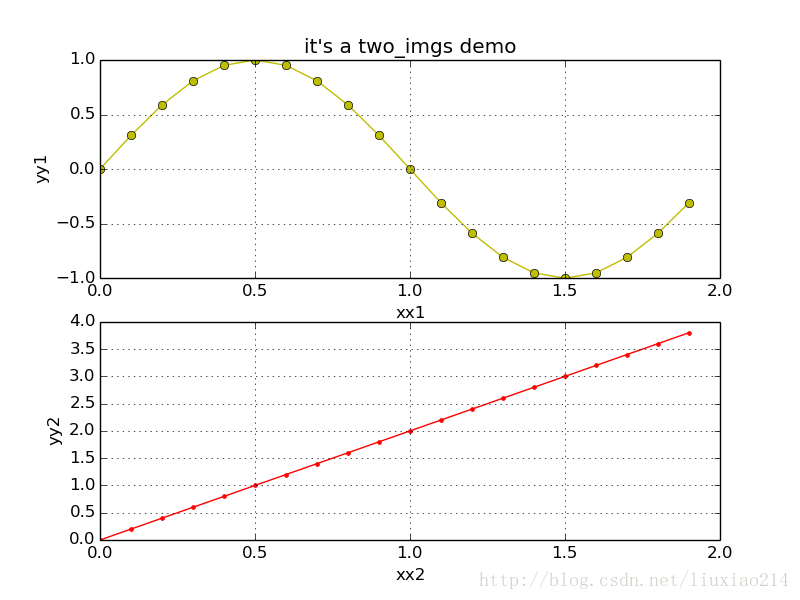
3、绘制直方图
def Histogram_demo():
    # set u and &
    mean = 100
    sigma = 10

    # produce normal distribution , 10000个数
    x = mean + sigma * np.random.randn(10000)

    num_bins = 50  # 共50个格子
    # 直方图函数, normed=1即和为1,
    # 返回50个概率、直方块左边线的x值、各个方块对象
    n, bins, patches = plt.hist(x, num_bins, normed=1, facecolor='yellow', alpha=0.5)
    y = mlab.normpdf(bins, mean, sigma)  # 一条逼近的曲线

    plt.plot(bins, y, "r--")
    plt.title("Histogram of XXX: $\mu=100$, $\sigma=10$")
    plt.xlabel("x-label")
    plt.ylabel("y-label")
    plt.grid()
    plt.subplots_adjust(left=0.15)
    plt.savefig("Histogram_demo.png")
    plt.show()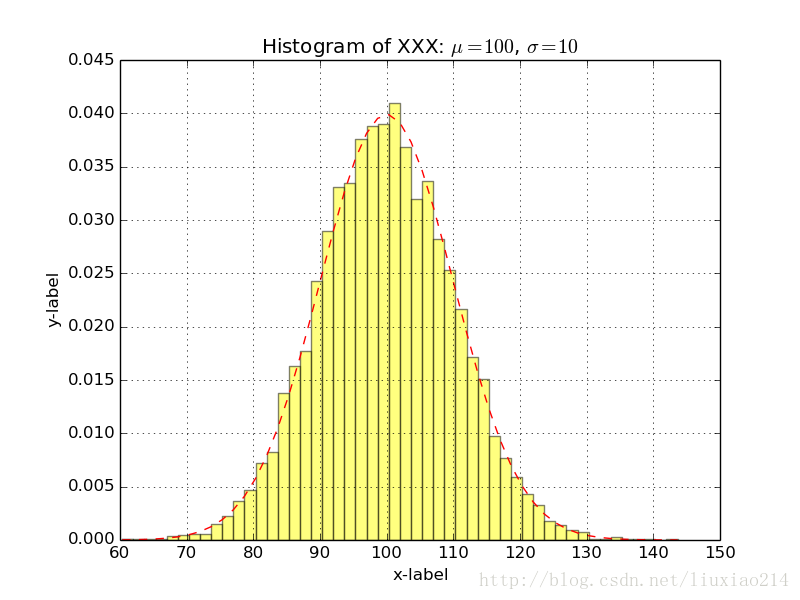
4、绘制三维空间坐标点
def d3_points():
    x_list = [[3,3,2],[4,3,1],[1,2,3],[1,1,2],[2,1,2]]
    fig = plt.figure() # 得到画面
    ax = fig.gca(projection='3d') # 得到3d坐标的图
    # 画点
    for x in x_list:
        ax.scatter(x[0],x[1],x[2],c='r')
    plt.savefig("d3_image.png")
    plt.show()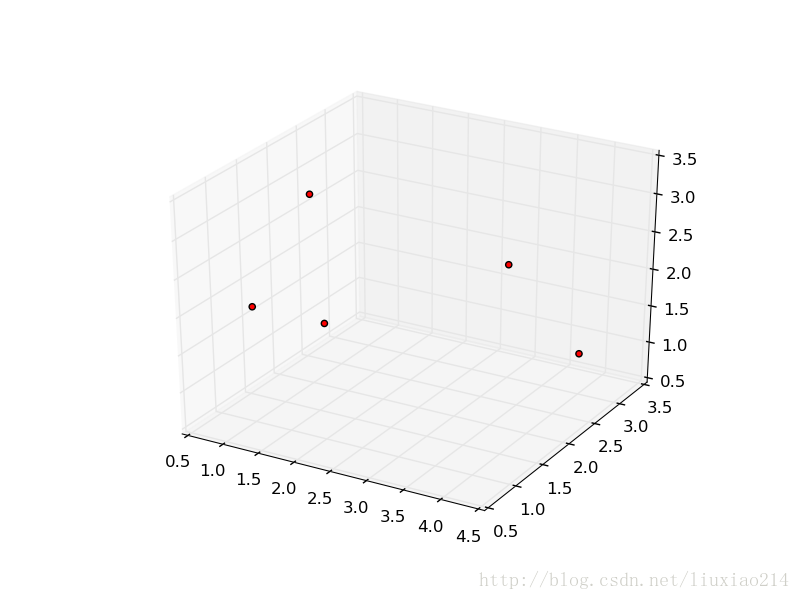
5、绘制三维空间平面
def d3_plane():
    fig = plt.figure()
    ax = fig.add_subplot(1,1,1,projection='3d')  # 一行一列第一个
    X = np.arange(1, 10, 1)
    Y = np.arange(1, 10, 1)
    X,Y = np.meshgrid(X, Y)  # 将坐标向量变为坐标矩阵,列为x的长度,行为y的长度
    Z = 3*X + 2*Y + 30

    # 构建平面
    surf = ax.plot_surface(X, Y, Z, rstride=1, cstride=1, cmap=cm.jet, linewidth=0, antialiased=True)

    ax.set_xlabel("x-label", color='r')
    ax.set_ylabel("y-label", color='g')
    ax.set_zlabel("z-label", color='b')

    ax.set_zlim3d(0, 100) # 设置z坐标轴
    fig.colorbar(surf, shrink=0.5, aspect=5) # 图例

    plt.savefig("d3_plane.png")
    plt.show()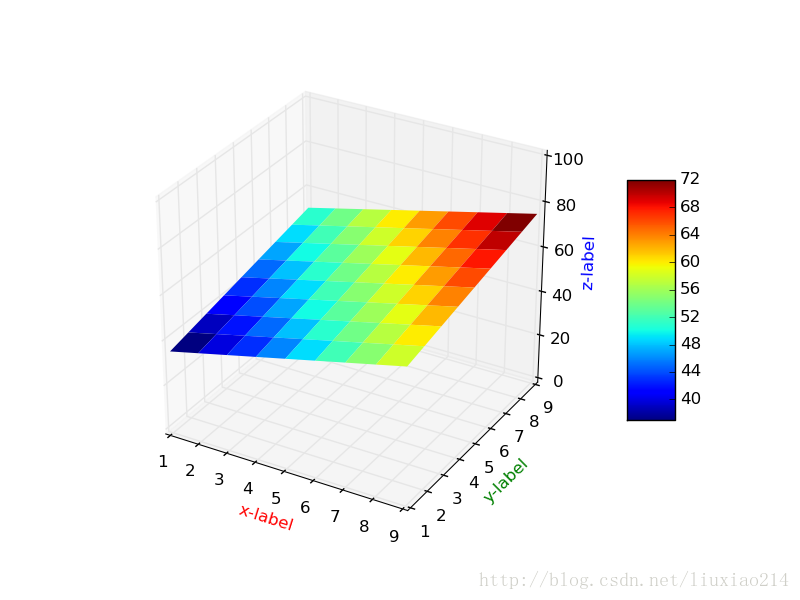
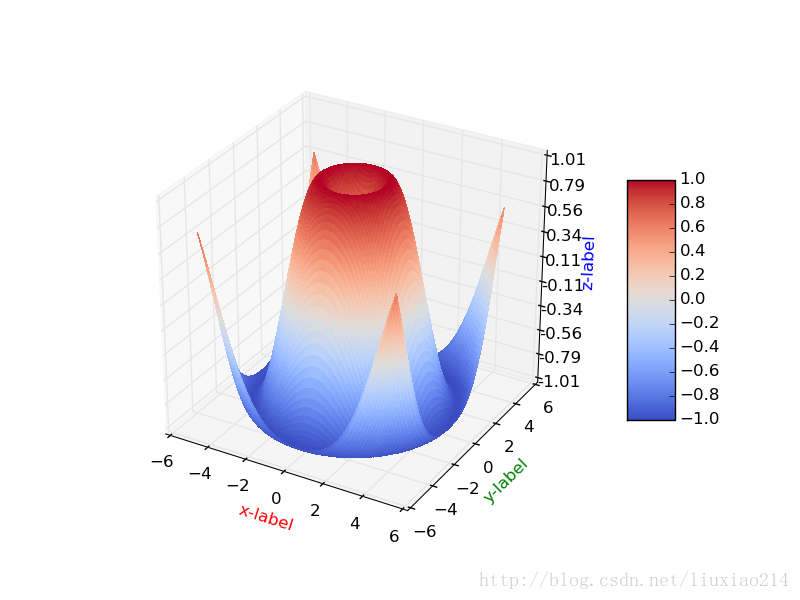
6、绘制三维空间曲面
def d3_hookface():
    fig = plt.figure()  # 得到画面
    ax = fig.gca(projection='3d')  # 得到3d坐标的图
    X = np.arange(-5, 5, 0.1)
    Y = np.arange(-5, 5, 0.1)
    X,Y = np.meshgrid(X, Y)  # 将坐标向量变为坐标矩阵,列为x的长度,行为y的长度
    R = np.sqrt(X**2 + Y**2)
    Z = np.sin(R)
    # 曲面,x,y,z坐标,横向步长,纵向步长,颜色,线宽,是否渐变
    surf = ax.plot_surface(X, Y, Z, rstride=1, cstride=1, cmap=cm.coolwarm, linewidth=0, antialiased=False)
    ax.set_zlim(-1.01, 1.01)

    ax.set_xlabel("x-label", color='r')
    ax.set_ylabel("y-label", color='g')
    ax.set_zlabel("z-label", color='b')

    ax.zaxis.set_major_locator(LinearLocator(10))  # 设置z轴标度
    ax.zaxis.set_major_formatter(FormatStrFormatter('%0.02f'))  # 设置z轴精度
    # shrink颜色条伸缩比例0-1, aspect颜色条宽度(反比例,数值越大宽度越窄)
    fig.colorbar(surf, shrink=0.5, aspect=5)

    plt.savefig("d3_hookface.png")
    plt.show()
7、汇总代码
# -- coding: utf-8 --

import matplotlib.pyplot as plt
import matplotlib.mlab as mlab
import numpy as np
from matplotlib import cm
from matplotlib.ticker import LinearLocator, FormatStrFormatter
from mpl_toolkits.mplot3d import Axes3D

def initial_image():

    # define x\y
    x = np.arange(0.0, 2.0, 0.05)
    s = np.sin(np.pi * x)

    # set color and linestyle
    plt.plot(x, s, "yo-")

    # set tilte and x\y labels
    plt.title("it's just a test")
    plt.xlabel("x-label")
    plt.ylabel("y-label")

    plt.grid() # set gridding
    plt.savefig("initial_img.png") # save image
    plt.show() # show the image

def two_images():

    x = np.arange(0.0, 2.0, 0.1)
    s1 = np.sin(np.pi * x)
    s2 = x * 2

    plt.subplot(2, 1, 1) # devide 2 rows and 1 cols and get first row
    plt.plot(x, s1, "yo-")
    plt.title("it's a two_imgs demo")
    plt.xlabel("xx1")
    plt.ylabel("yy1")
    plt.grid()

    plt.subplot(2, 1, 2)
    plt.plot(x, s2, "r.-")
    plt.xlabel("xx2")
    plt.ylabel("yy2")
    plt.grid()
    plt.savefig("two_images.png")
    plt.show()

def Histogram_demo():
    # set u and &
    mean = 100
    sigma = 10

    # produce normal distribution , 10000个数
    x = mean + sigma * np.random.randn(10000)

    num_bins = 50  # 共50个格子
    # 直方图函数, normed=1即和为1,
    # 返回50个概率、直方块左边线的x值、各个方块对象
    n, bins, patches = plt.hist(x, num_bins, normed=1, facecolor='yellow', alpha=0.5)
    y = mlab.normpdf(bins, mean, sigma)  # 一条逼近的曲线

    plt.plot(bins, y, "r--")
    plt.title("Histogram of XXX: $\mu=100$, $\sigma=10$")
    plt.xlabel("x-label")
    plt.ylabel("y-label")
    plt.grid()
    plt.subplots_adjust(left=0.15)
    plt.savefig("Histogram_demo.png")
    plt.show()

def d3_points():
    x_list = [[3,3,2],[4,3,1],[1,2,3],[1,1,2],[2,1,2]]
    fig = plt.figure() # 得到画面
    ax = fig.gca(projection='3d') # 得到3d坐标的图
    # 画点
    for x in x_list:
        ax.scatter(x[0],x[1],x[2],c='r')
    plt.savefig("d3_image.png")
    plt.show()

def d3_plane():
    fig = plt.figure()
    ax = fig.add_subplot(1,1,1,projection='3d')  # 一行一列第一个
    X = np.arange(1, 10, 1)
    Y = np.arange(1, 10, 1)
    X,Y = np.meshgrid(X, Y)  # 将坐标向量变为坐标矩阵,列为x的长度,行为y的长度
    Z = 3*X + 2*Y + 30

    # 构建平面
    surf = ax.plot_surface(X, Y, Z, rstride=1, cstride=1, cmap=cm.jet, linewidth=0, antialiased=True)

    ax.set_xlabel("x-label", color='r')
    ax.set_ylabel("y-label", color='g')
    ax.set_zlabel("z-label", color='b')

    ax.set_zlim3d(0, 100) # 设置z坐标轴
    fig.colorbar(surf, shrink=0.5, aspect=5) # 图例

    plt.savefig("d3_plane.png")
    plt.show()

def d3_hookface():
    fig = plt.figure()  # 得到画面
    ax = fig.gca(projection='3d')  # 得到3d坐标的图
    X = np.arange(-5, 5, 0.1)
    Y = np.arange(-5, 5, 0.1)
    X,Y = np.meshgrid(X, Y)  # 将坐标向量变为坐标矩阵,列为x的长度,行为y的长度
    R = np.sqrt(X**2 + Y**2)
    Z = np.sin(R)
    # 曲面,x,y,z坐标,横向步长,纵向步长,颜色,线宽,是否渐变
    surf = ax.plot_surface(X, Y, Z, rstride=1, cstride=1, cmap=cm.coolwarm, linewidth=0, antialiased=False)
    ax.set_zlim(-1.01, 1.01)

    ax.set_xlabel("x-label", color='r')
    ax.set_ylabel("y-label", color='g')
    ax.set_zlabel("z-label", color='b')

    ax.zaxis.set_major_locator(LinearLocator(10))  # 设置z轴标度
    ax.zaxis.set_major_formatter(FormatStrFormatter('%0.02f'))  # 设置z轴精度
    # shrink颜色条伸缩比例0-1, aspect颜色条宽度(反比例,数值越大宽度越窄)
    fig.colorbar(surf, shrink=0.5, aspect=5)

    plt.savefig("d3_hookface.png")
    plt.show()

def main():
    initial_image()
    two_images()
    Histogram_demo()
    d3_points()
    d3_plane()
    d3_hookface()

if __name__ == '__main__':
    main()


 4110
4110


 被折叠的 条评论
为什么被折叠?
被折叠的 条评论
为什么被折叠?
 到【灌水乐园】发言


