


参考博客:https://xueqiu.com/8287840120/75542824
import numpy as np
import statsmodels.api as sm
import statsmodels.formula.api as smf
aapl = web.get_data_yahoo('AAPL', '2000-01-01')['Adj Close']
msft = web.get_data_yahoo('MSFT', '2000-01-01')['Adj Close']
msft = web.get_data_yahoo('MSFT', '2000-01-01')['Adj Close']
aapl_rets = aapl.pct_change()
msft_rets = msft.pct_change()
msft_rets = msft.pct_change()
plt.figure()
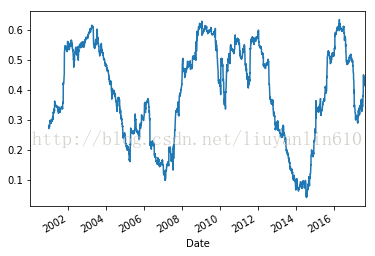
aapl_rets.rolling( 250).corr( msft_rets).plot()
aapl_rets.rolling( 250).corr( msft_rets).plot()
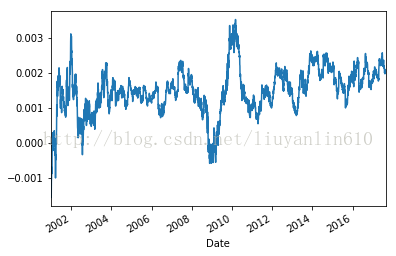
mm = msft_rets.rolling(250).mean()
results = smf.ols('aapl_rets~MSFT', data=pd.DataFrame({'MSFT': mm}))
results.fit().fittedvalues.plot()


 1056
1056


 被折叠的 条评论
为什么被折叠?
被折叠的 条评论
为什么被折叠?
 到【灌水乐园】发言


