


excerpt from "programming collective intelligence"...
A slightly more sophisticated way to determine the similarity between people’s inter-
ests is to use a Pearson correlation coefficient. The correlation coefficient is a mea-
sure of how well two sets of data fit on a straight line. The formula for this is more
complicated than the Euclidean distance score, but it tends to give better results in
situations where the data isn’t well normalized—for example, if critics’ movie rank-
ings are routinely more harsh than average.
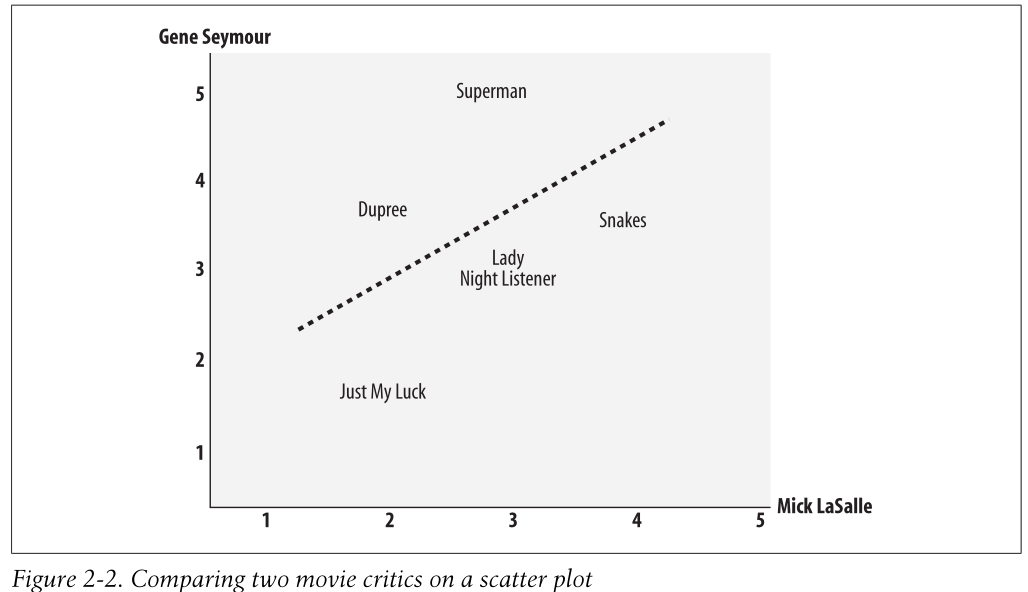
You can also see a straight line on the chart. This is called the best-fit line because it
comes as close to all the items on the chart as possible. If the two critics had identi-
cal ratings for every movie, this line would be diagonal and would touch every item
in the chart, giving a perfect correlation score of 1. In the case illustrated, the critics
disagree on a few movies, so the correlation score is about 0.4. Figure 2-3 shows an
example of a much higher correlation, one of about 0.75.
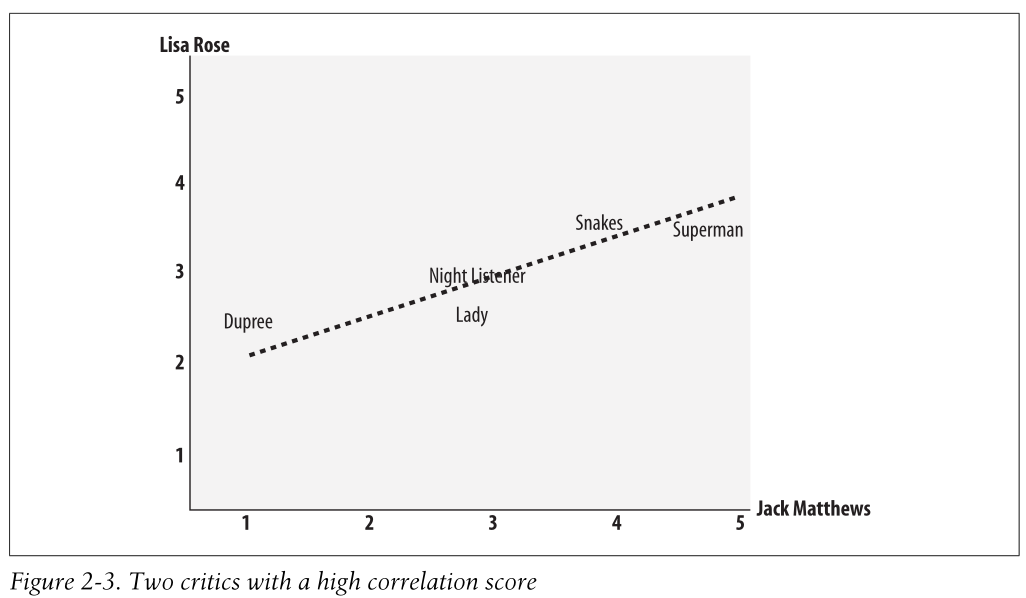
One interesting aspect of using the Pearson score, which you can see in the figure, is
that it corrects for grade inflation. In this figure, Jack Matthews tends to give higher
scores than Lisa Rose, but the line still fits because they have relatively similar prefer-
ences. If one critic is inclined to give higher scores than the other, there can still be
perfect correlation if the difference between their scores is consistent. The Euclidean
distance score described earlier will say that two critics are dissimilar because one is
consistently harsher than the other, even if their tastes are very similar. Depending
on your particular application, this behavior may or may not be what you want.
The code for the Pearson correlation score first finds the items rated by both critics.
It then calculates the sums and the sum of the squares of the ratings for the two crit-
ics, and calculates the sum of the products of their ratings. Finally, it uses these
results to calculate the Pearson correlation coefficient, shown in bold in the code
below. Unlike the distance metric, this formula is not very intuitive, but it does tell
you how much the variables change together divided by the product of how much
they vary individually.


 3318
3318

 被折叠的 条评论
为什么被折叠?
被折叠的 条评论
为什么被折叠?
 到【灌水乐园】发言


