


1.下面是实现3个子图竖着排占1列;
\begin{figure}[htbp]

    \centering

    \subfigure[Number of elements read] {\includegraphics[height=2in,width=2in,angle=0]{fig/Graph1.eps}}

    \subfigure[Size of disk files scanned] {\includegraphics[height=2in,width=2in,angle=0]{fig/Graph2.eps}}

    \subfigure[Execution time] {\includegraphics[height=2in,width=2in,angle=0]{fig/Graph3.eps}}

    \caption{ PathStack versus TJFast using XMark data }

    \label{fig5}

\end{figure}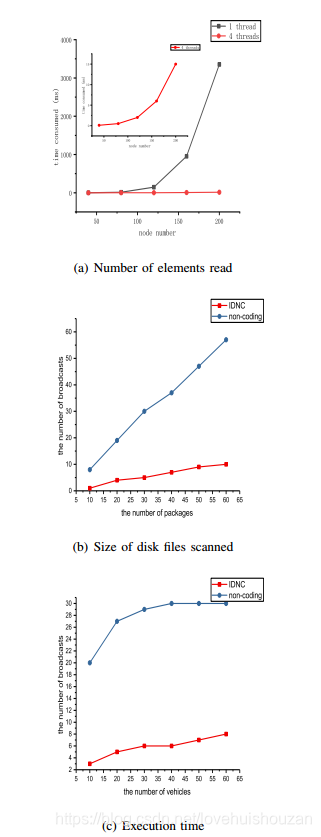
2.下面是“3个子图并排占2列”的代码:
\begin{figure*}[!htbp]


\centering
\subfigure[fig1]{
	\label{fig:subfig:a} %% label for first subfigure
	\includegraphics[width=3.2cm,height=3.5cm]{fig/Graph1.eps}}
\hspace{0.5in}
\subfigure[fig2]{
	\label{fig:subfig:b} %% label for second subfigure
	\includegraphics[width=3.2cm,height=3.5cm]{fig/Graph2.eps}}
\hspace{0.5in}
\subfigure[fig3]{
	\label{fig:subfig:c} %% label for second subfigure
	\includegraphics[width=3.2cm,height=3.5cm]{fig/Graph3.eps}}
\caption{dabiaoti}
\label{fig:subfig} %% label for entire figure
\end{figure*}


\begin{table}[htbp]
	\caption{Table Type Styles}
	\begin{center}
		\begin{tabular}{cccc}
			\hline
			\hline
			\textbf{Table}&\multicolumn{3}{c}{\textbf{Table Column Head}} \\
			\cline{2-4}
			\textbf{Head} & \textbf{\textit{Table column subhead}}& \textbf{\textit{Subhead}}& \textbf{\textit{Subhead}} \\
			\hline
			copy& More table copy$^{\mathrm{a}}$& aa & bb  \\
			\hline
			cc& dd $^{\mathrm{a}}$& aa & bb  \\
			\hline
			\hline
			%\multicolumn{4}{l}{$^{\mathrm{a}}$Sample of a Table footnote.}
		\end{tabular}
		\label{tab1}
	\end{center}
\end{table}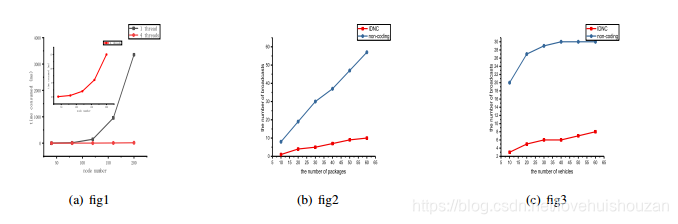
3.下面是实现3线表实现代码:
\begin{table}[htbp]
	\caption{Table Type Styles}
	\begin{center}
		\begin{tabular}{cccc}
			\hline
			\hline
			\textbf{Table}&\multicolumn{3}{c}{\textbf{Table Column Head}} \\
			\cline{2-4}
			\textbf{Head} & \textbf{\textit{Table column subhead}}& \textbf{\textit{Subhead}}& \textbf{\textit{Subhead}} \\
			\hline
			copy& More table copy$^{\mathrm{a}}$& aa & bb  \\
			\hline
			cc& dd $^{\mathrm{a}}$& aa & bb  \\
			\hline
			\hline
			%\multicolumn{4}{l}{$^{\mathrm{a}}$Sample of a Table footnote.}
		\end{tabular}
		\label{tab1}
	\end{center}
\end{table}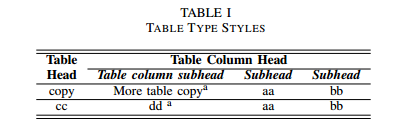


 8654
8654

 被折叠的 条评论
为什么被折叠?
被折叠的 条评论
为什么被折叠?
 到【灌水乐园】发言


