


前言
日前使用hooks的方式封装组件,在我使用复杂的图标时候遇到了些问题,预想在onMounted中初始化echarts,在使用hooks的时候,组件没有渲染完,使用实例会出现各种各样的问题,并且在hooks中使用一些外部属性也属实遇到了些麻烦,先用蠢方法直接封装两个插件做dashboard用,后面有时间重新完善封装echarts。
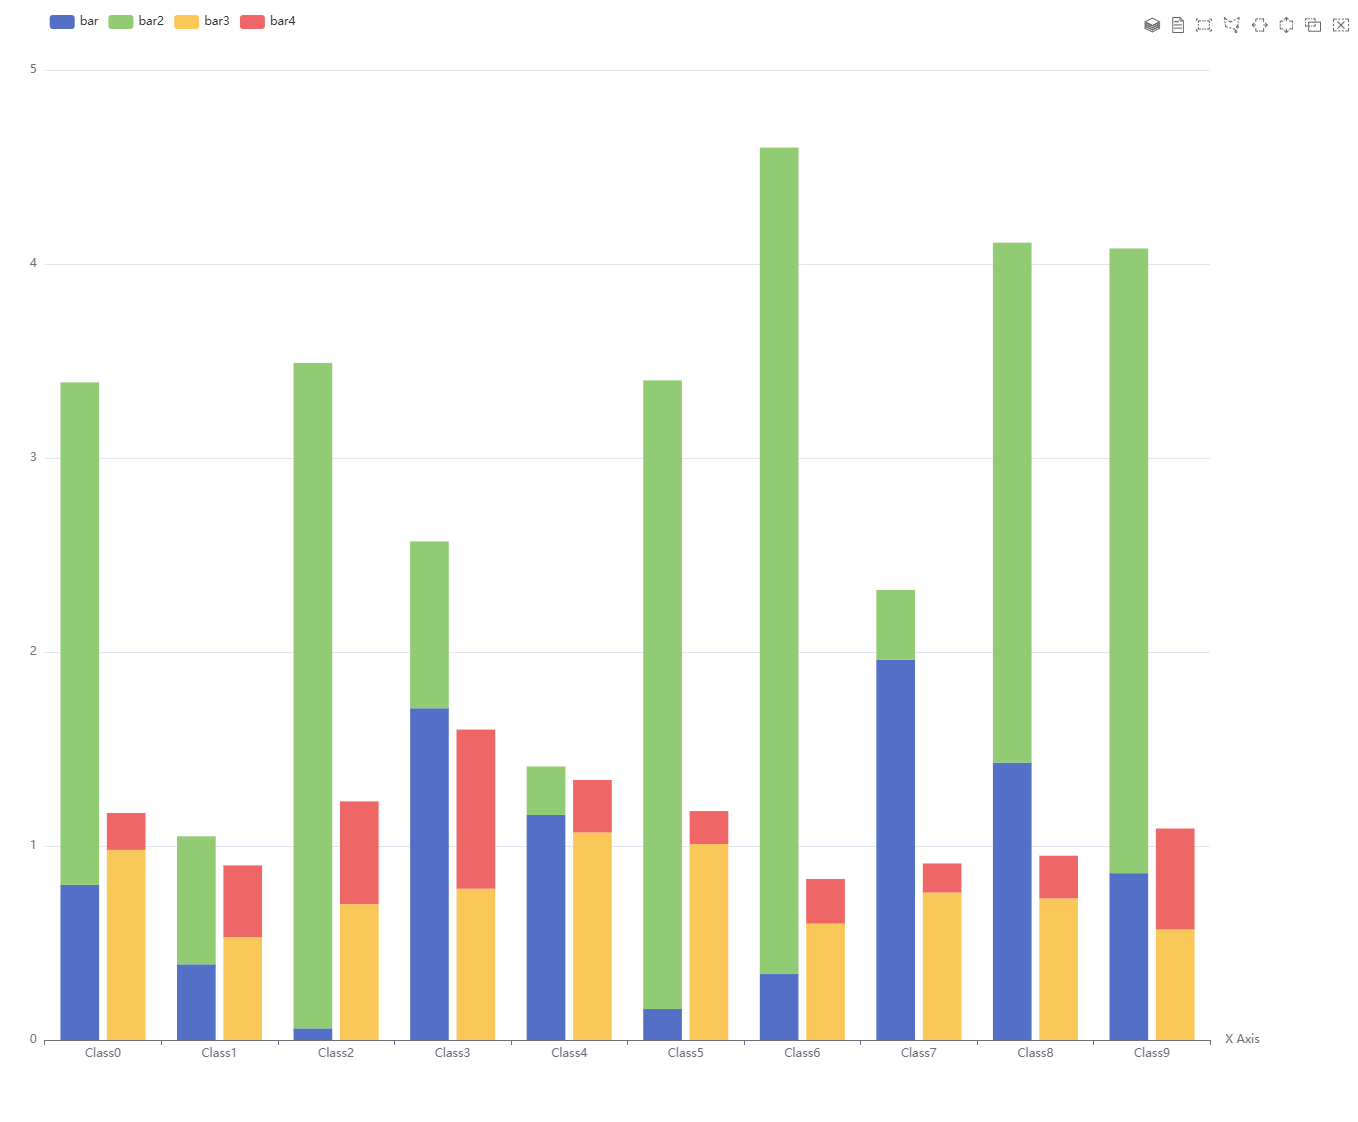
一、柱状图框选
柱状图框选,新建组件EChartsBarBrush.vue:
<template>
  <div ref="chartContainer" style="width: 100%; height: 100%"></div>
</template>

<script setup lang="ts" name="">
import useECharts from '@/hooks/useECharts';
import { ref, onMounted, onUnmounted } from 'vue';
import * as echarts from 'echarts';

const chartContainer = ref(null);


let xAxisData: string[] = [];
let data1: number[] = [];
let data2: number[] = [];
let data3: number[] = [];
let data4: number[] = [];

for (let i = 0; i < 10; i++) {
  xAxisData.push('Class' + i);
  data1.push(+(Math.random() * 2).toFixed(2));
  data2.push(+(Math.random() * 5).toFixed(2));
  data3.push(+(Math.random() + 0.3).toFixed(2));
  data4.push(+Math.random().toFixed(2));
}

var emphasisStyle = {
  itemStyle: {
    shadowBlur: 10,
    shadowColor: 'rgba(0,0,0,0.3)'
  }
};

const options = ref({
  legend: {
    data: ['bar', 'bar2', 'bar3', 'bar4'],
    left: '10%'
  },
  brush: {
    toolbox: ['rect', 'polygon', 'lineX', 'lineY', 'keep', 'clear'],
    xAxisIndex: 0
  },
  toolbox: {
    feature: {
      magicType: {
        type: ['stack']
      },
      dataView: {}
    }
  },
  tooltip: {},
  xAxis: {
    data: xAxisData,
    name: 'X Axis',
    axisLine: { onZero: true },
    splitLine: { show: false },
    splitArea: { show: false }
  },
  yAxis: {},
  grid: {
    bottom: 100
  },
  series: [
    {
      name: 'bar',
      type: 'bar',
      stack: 'one',
      emphasis: emphasisStyle,
      data: data1
    },
    {
      name: 'bar2',
      type: 'bar',
      stack: 'one',
      emphasis: emphasisStyle,
      data: data2
    },
    {
      name: 'bar3',
      type: 'bar',
      stack: 'two',
      emphasis: emphasisStyle,
      data: data3
    },
    {
      name: 'bar4',
      type: 'bar',
      stack: 'two',
      emphasis: emphasisStyle,
      data: data4
    }
  ]
});
// const chartInstance = useECharts(chartContainer, options);
onMounted(() => {
    // 初始化 ECharts 实例
   const chartInstance = echarts.init(chartContainer.value);
    // 设置 ECharts 配置项
    chartInstance.setOption(options.value);

    chartInstance.on('brushSelected', function (params: any) {

  var brushed = [];
  var brushComponent = params.batch[0];

  for (var sIdx = 0; sIdx < brushComponent.selected.length; sIdx++) {
    var rawIndices = brushComponent.selected[sIdx].dataIndex;
    brushed.push('[Series ' + sIdx + '] ' + rawIndices.join(', '));
  }

  chartInstance.setOption({
    title: {
      backgroundColor: '#333',
      text: 'SELECTED DATA INDICES: \n' + brushed.join('\n'),
      bottom: 0,
      right: '10%',
      width: 100,
      textStyle: {
        fontSize: 12,
        color: '#fff'
      }
    }
  });
});

    // 监听窗口大小变化,自动调整图表大小
    window.addEventListener('resize', () => chartInstance.resize());
  });

</script>

<style lang='scss' scoped>
</style>
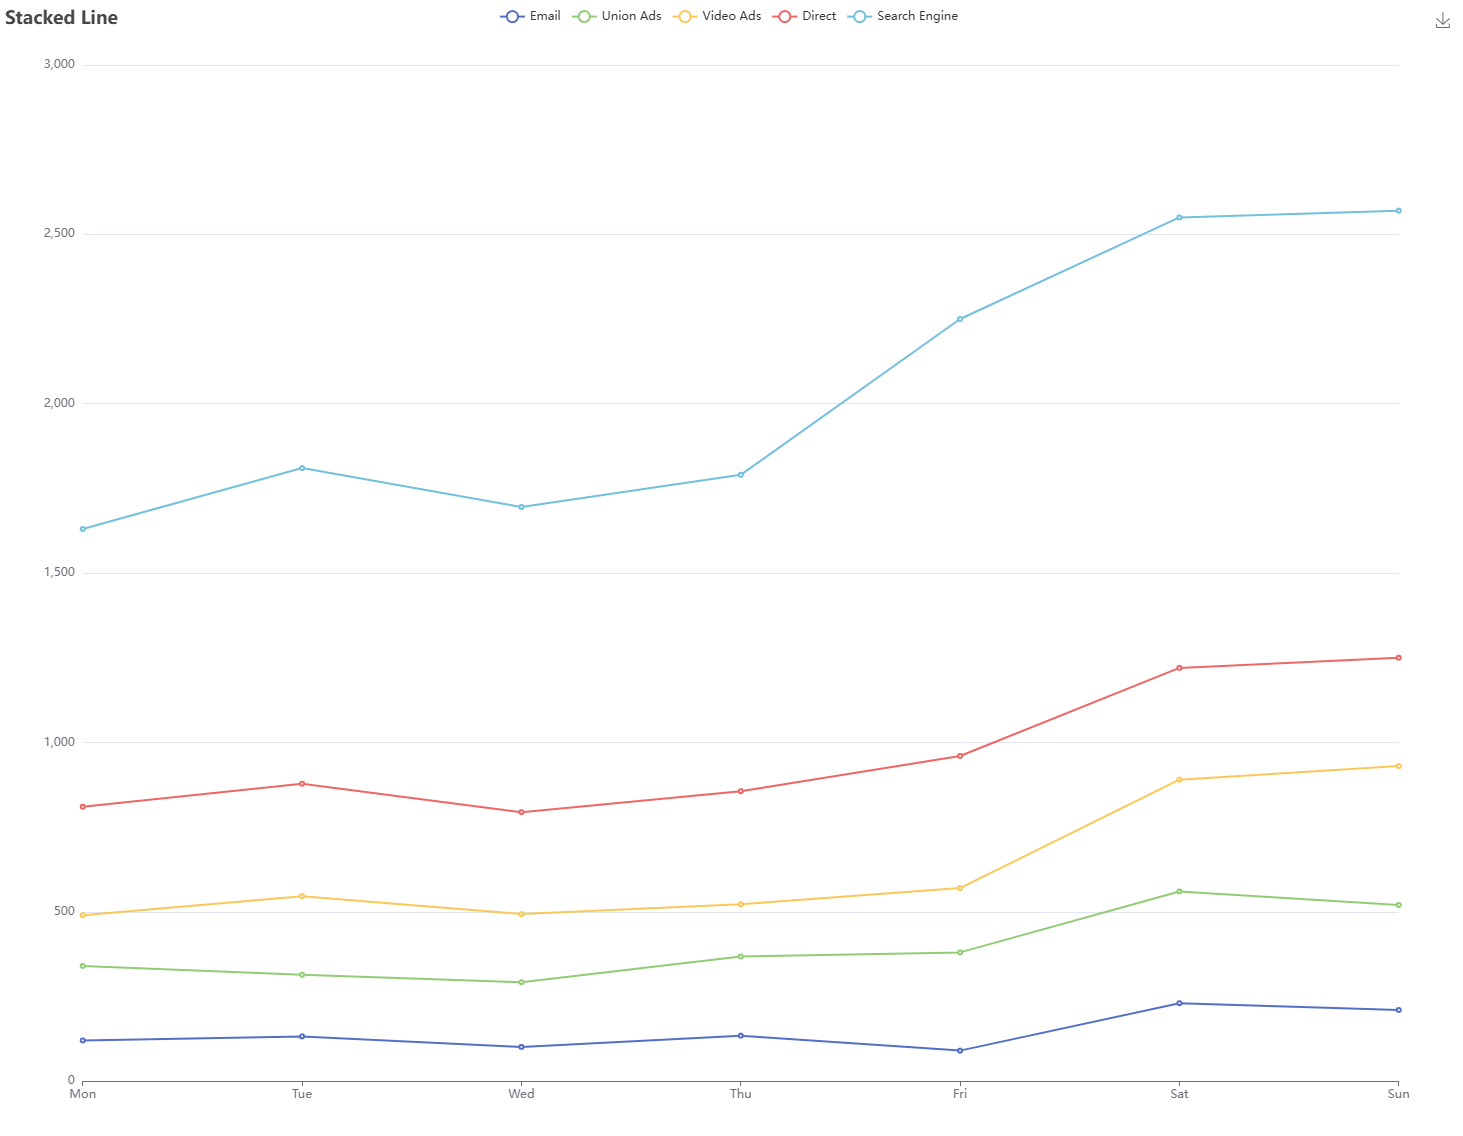
二、折线图堆叠
折线图堆叠,新建EChartSlineStack.vue
<template>
  <div ref="chartContainer" style="width: 100%; height: 100%"></div>
</template>

<script setup lang="ts" name="">
import { ref } from 'vue';
import useECharts from '@/hooks/useECharts';


const chartContainer = ref(null);
const options = ref({
  title: {
    text: 'Stacked Line'
  },
  tooltip: {
    trigger: 'axis'
  },
  legend: {
    data: ['Email', 'Union Ads', 'Video Ads', 'Direct', 'Search Engine']
  },
  grid: {
    left: '3%',
    right: '4%',
    bottom: '3%',
    containLabel: true
  },
  toolbox: {
    feature: {
      saveAsImage: {}
    }
  },
  xAxis: {
    type: 'category',
    boundaryGap: false,
    data: ['Mon', 'Tue', 'Wed', 'Thu', 'Fri', 'Sat', 'Sun']
  },
  yAxis: {
    type: 'value'
  },
  series: [
    {
      name: 'Email',
      type: 'line',
      stack: 'Total',
      data: [120, 132, 101, 134, 90, 230, 210]
    },
    {
      name: 'Union Ads',
      type: 'line',
      stack: 'Total',
      data: [220, 182, 191, 234, 290, 330, 310]
    },
    {
      name: 'Video Ads',
      type: 'line',
      stack: 'Total',
      data: [150, 232, 201, 154, 190, 330, 410]
    },
    {
      name: 'Direct',
      type: 'line',
      stack: 'Total',
      data: [320, 332, 301, 334, 390, 330, 320]
    },
    {
      name: 'Search Engine',
      type: 'line',
      stack: 'Total',
      data: [820, 932, 901, 934, 1290, 1330, 1320]
    }
  ]
});

const chartInstance = useECharts(chartContainer, options);

// 你可以在这里根据需要操作 ECharts 实例,例如更新数据
// chartInstance.value.setOption({...})
</script>

<style lang='scss' scoped>
</style>
总结
为啥这两天封装了好几个echarts组件呢,上头了一样,通过封装ECharts组件,可以将图表的基本配置、数据处理、事件处理等逻辑封装在一个组件中,从而实现代码的复用。这样,在需要使用相同类型的图表时,只需引入该组件,而无需重复编写相同的代码。明天就体验一下好处。
得意勿恣意奢侈,失意勿抑郁失措。


 1964
1964


 被折叠的 条评论
为什么被折叠?
被折叠的 条评论
为什么被折叠?
 到【灌水乐园】发言


