


记录 vue3+Ts 项目中,按需引入echarts并进行二次封装使用。
1、安装:npm i echarts

2、新增按需引入配置文件:config.ts
文件路径:src/componets/baseEcharts/config.ts
// 引入 echarts 核心模块,核心模块提供了 echarts 使用必须要的接口。
import * as echarts from "echarts/core";

// 引入内置组件,组件后缀都为Component
import {
  TitleComponent,
  TooltipComponent,
  GridComponent,
  PolarComponent,
  AriaComponent,
  ParallelComponent,
  LegendComponent,
  RadarComponent,
  ToolboxComponent,
  DatasetComponent, // 数据集组件
  DataZoomComponent,
  VisualMapComponent,
  TimelineComponent,
  CalendarComponent,
  GraphicComponent,
  TransformComponent, // 数据转换器组件(filter, sort)
} from "echarts/components";

// 引入渲染器:echarst默认使用canvas渲染,引入 CanvasRenderer 或者 SVGRenderer 是必须的一步
import { CanvasRenderer, SVGRenderer } from "echarts/renderers";

// 标签自动布局、全局过渡动画等特性
import { LabelLayout, UniversalTransition } from "echarts/features";

// 引入图表类型,后缀都为Chart
import {
  BarChart,
  LineChart,
  PieChart,
  MapChart,
  RadarChart,
  PictorialBarChart,
} from "echarts/charts";

// 注册必须的组件
echarts.use([
  // 内置组件
  TitleComponent,
  TooltipComponent,
  GridComponent,
  PolarComponent,
  AriaComponent,
  ParallelComponent,
  LegendComponent,
  RadarComponent,
  ToolboxComponent,
  DatasetComponent,
  DataZoomComponent,
  VisualMapComponent,
  TimelineComponent,
  CalendarComponent,
  GraphicComponent,
  TransformComponent,
  // 渲染器
  CanvasRenderer,
  SVGRenderer,
  // 特性
  LabelLayout,
  UniversalTransition,
  // 图表
  BarChart,
  LineChart,
  PieChart,
  MapChart,
  RadarChart,
  PictorialBarChart,
]);

export default echarts;
3、封装成hooks:useEcharts.ts
文件路径:src/hooks/useEcharts.ts
import {
  Ref,
  shallowRef,
  unref,
  onMounted,
  onDeactivated,
  onBeforeUnmount,
} from "vue";

import echarts from "@/components/baseEcharts/config";

export type EChartsCoreOption = echarts.EChartsCoreOption;

const useEcharts = (elRef: Ref<HTMLDivElement>, options: EChartsCoreOption) => {
  const charts = shallowRef<echarts.ECharts>();

  const setOptions = (options: EChartsCoreOption) => {
    charts.value && charts.value.setOption(options);
  };

  // 初始化
  const initCharts = (themeColor?: Array<string>) => {
    const el = unref(elRef);
    if (!el || !unref(el)) {
      return;
    }
    charts.value = echarts.init(el);
    if (themeColor) {
      options.color = themeColor;
    }
    setOptions(options);
  };

  // 重新窗口变化时,重新计算
  const resize = () => {
    charts.value && charts.value.resize();
  };

  onMounted(() => {
    window.addEventListener("resize", resize);
  });

  // 页面keepAlive时,不监听页面
  onDeactivated(() => {
    window.removeEventListener("resize", resize);
  });

  onBeforeUnmount(() => {
    window.removeEventListener("resize", resize);
  });

  return {
    initCharts,
    setOptions,
    resize,
  };
};

export { useEcharts };
4、封装成基础组件:baseEcharts.vue
文件路径:src/componets/baseEcharts/index.vue(和config.ts同一文件夹下)
<template>
  <div
    :style="{
      width: width,
      height: height,
    }"
    ref="echartsRef"
  />
</template>

<script setup lang="ts">
import { ref, onMounted, watch, PropType } from "vue";
import { useEcharts, EChartsCoreOption } from "../hooks/useEchart.ts"; // 引入hooks

const props = defineProps({
  options: { type: Object as PropType<EChartsCoreOption>, required: true },
  height: { type: String, default: "100%" },
  width: { type: String, default: "100%" },
  themeColors: { type: Array as PropType<string[]>, default: () => [] },
});

const echartsRef = ref();

const { setOptions, initCharts } = useEcharts(echartsRef, props.options);

watch(
  () => props.options,
  (nVal) => {
    let targetOptions: EChartsCoreOption = {};
    if (props.themeColors && props.themeColors.length > 0) {
      targetOptions = { ...nVal };
      targetOptions.color = props.themeColors;
    } else {
      targetOptions = { ...nVal };
    }
    setOptions(targetOptions);
  }
);

onMounted(() => {
  initCharts();
});
</script>
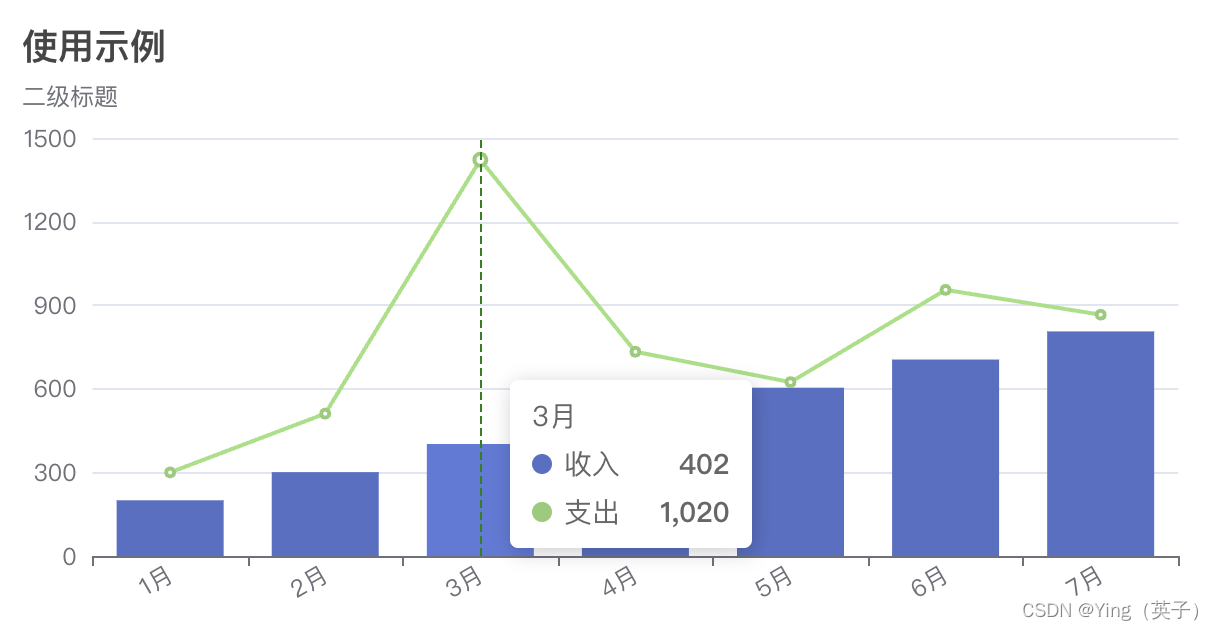
5、使用示例
<template>
  <BaseEcharts :options="options" height="300px" />
</template>

<script lang="ts" setup>
import BaseEcharts from "@/components/baseEcharts/index.vue";

const options = {
  title: {
    text: "使用示例",
    subtext: "二级标题",
    subTextStyle: {
      fontSize: 16,
      fontWeight: "normal",
      left: "center",
      y: "center",
    },
  },
  tooltip: {
    trigger: "axis",
    axisPointer: {
      lineStyle: {
        width: 1,
        color: "#008000",
      },
    },
  },
  grid: {
    left: "1%",
    right: "1%",
    bottom: "1%",
    top: "60px",
    containLabel: true,
  },
  xAxis: {
    type: "category",
    data: ["1月", "2月", "3月", "4月", "5月", "6月", "7月"],
    axisLabel: {
      interval: 0,
      rotate: 30,
    },
  },
  yAxis: {
    axisLabel: {
      formatter: (val: number) => {
        return val;
      },
    },
  },
  series: [
    {
      name: "收入",
      type: "bar",
      stack: "Total",
      data: [200, 301, 402, 503, 604, 705, 806],
    },
    {
      name: "支出",
      type: "line",
      stack: "Total",
      data: [100, 210, 1020, 230, 20, 250, 60],
    },
  ],
};
</script>


 60
60


 被折叠的 条评论
为什么被折叠?
被折叠的 条评论
为什么被折叠?
 到【灌水乐园】发言


