


内容简介
本文的主要内容为:求两个形状的相交边界。
用的函数为python自带的intersection函数,输出为相交区域的轮廓点。
画图用的是mlt 中的Polygon 函数,这个图形展示很有意思,可以在很多展示地方借鉴。
本文转载自:python计算两个矩形的重叠,在Python中查找多个重叠矩形的相交区域
python程序
import time
from shapely.geometry import box
# make some rectangles (for demonstration purposes and intersect with each other)
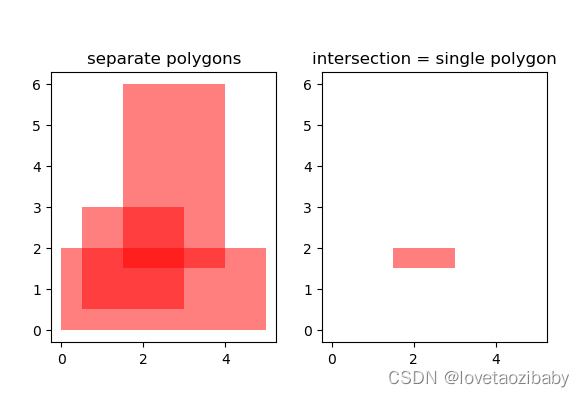
rect1 = box(0,0,5,2)
rect2 = box(0.5,0.5,3,3)
rect3 = box(1.5,1.5,4,6)
rect_list = [rect1, rect2, rect3]
# find intersection of rectangles (probably a more elegant way to do this)
t0 = time.time()
for rect in rect_list[1:]:
rect1 = rect1.intersection(rect)
t1 = time.time()
print('运行一次相交函数耗时:%0.9f' % (t1-t0))
intersection = rect1
# plot the rectangles before and after merging
from matplotlib import pyplot as plt
from matplotlib.collections import PatchCollection
from matplotlib.patches import Polygon
patches = PatchCollection([Polygon(a.exterior) for a in rect_list], facecolor='red', linewidth=.5, alpha=.5)
intersect_patch = PatchCollection([Polygon(intersection.exterior)], facecolor='red', linewidth=.5, alpha=.5)
# plot
fig, ax = plt.subplots(1,2, subplot_kw=dict(aspect='equal'))
ax[0].add_collection(patches, autolim=True)
ax[0].autoscale_view()
ax[0].set_title('separate polygons')
ax[1].add_collection(intersect_patch, autolim=True)
ax[1].set_title('intersection = single polygon')
ax[1].set_xlim(ax[0].get_xlim())
ax[1].set_ylim(ax[0].get_ylim())
plt.show()
输出结果为:


 395
395


 被折叠的 条评论
为什么被折叠?
被折叠的 条评论
为什么被折叠?
 到【灌水乐园】发言


