


这是中高级诊断课程第4课,前面重点讲了sga的关键结构,比如Buffer cache,shared pool等,实际上其中还有一个经常被大家所忽视的一个结构;那就是large pool。
老规矩,在开始讲解large pool之前,这里我们先分享一下诊断群学员刚出炉的一个案例。

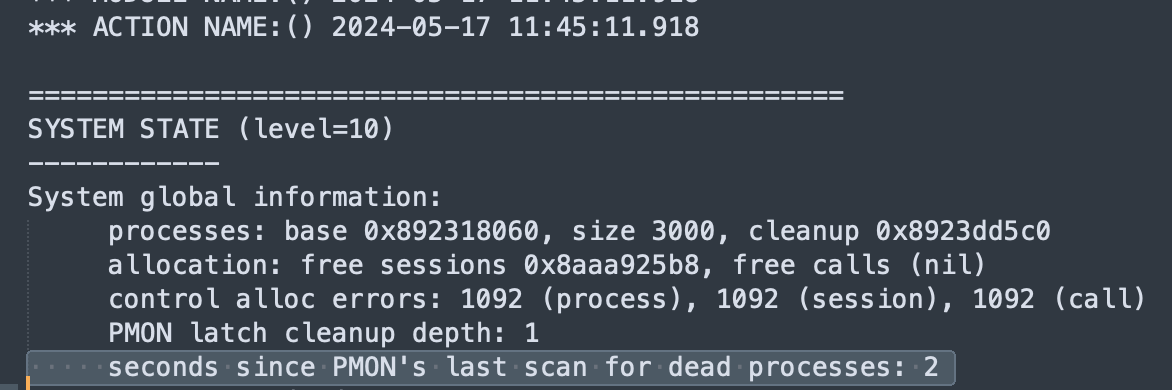
看上去在11:45:23左右,pmon进程直接将数据库实例crash了,此时产生了一个system state dump。
我们来看看这个状态dump的主要内容:
由此可以看出pmon进程发现了死进程,而该进程很可能是个核心进程,因此pmon 进程cleanup 死进程,数据库就crash了。这里我们直接搜索DEAD关键字:
PROCESS 10: DBW0
  ----------------------------------------
  SO: 0x8923e18a0, type: 2, owner: (nil), flag: INIT/-/-/0x00 if: 0x3 c: 0x3
   proc=0x8923e18a0, name=process, file=ksu.h LINE:12721, pg=0
  (process) Oracle pid:10, ser:1, calls cur/top: 0x89450e660/0x89450e660
            flags : (0x7) DEAD
            flags2: (0x0),  flags3: (0x10)
            intr error: 0, call error: 0, sess error: 0, txn error 0
            intr queue: empty
    ksudlp FALSE at location: 0
    Cleanup details:
      Found dead = 10 sec ago                  -----显示10秒之前已经死掉了
      Total Cleanup attempts = 0, Cleanup time = 0 sec, Cleanup timer = 0.000 sec
  (post info) last post received: 0 0 26
              last post received-location: ksa2.h LINE:285 ID:ksasnd
              last process to post me: 0x8aa45fef0 1 6
              last post sent: 0 0 152
              last post sent-location: kcbb.h LINE:2261 ID:kcbbza
              last process posted by me: 0x8923e2958 1 6
    (latch info) wait_event=0 bits=0x0
    Process Group: DEFAULT, pseudo proc: 0x8aaa814b8
    O/S info: user: oracle, term: UNKNOWN, ospid: 2079 (DEAD)
    OSD pid info: Unix process pid: 2079, image: oracle@db-1 (DBW0)
......
......
    ----------------------------------------
    SO: 0x893427360, type: 4, owner: 0x8923e18a0, flag: INIT/-/-/0x00 if: 0x3 c: 0x3
     proc=0x8923e18a0, name=session, file=ksu.h LINE:12729, pg=0
    (session) sid: 1134 ser: 1 trans: (nil), creator: 0x8923e18a0
              flags: (0x51) USR/- flags_idl: (0x1) BSY/-/-/-/-/-
              flags2: (0x409) -/-/INC
              DID: , short-term DID:
              txn branch: (nil)
              edition#: 0              oct: 0, prv: 0, sql: (nil), psql: (nil), user: 0/SYS
    ksuxds FALSE at location: 0
    service name: SYS$BACKGROUND
    Current Wait Stack:
     0: waiting for 'rdbms ipc message'
        timeout=0x12c, =0x0, =0x0
        wait_id=830509 seq_num=44092 snap_id=1
        wait times: snap=13.922218 sec, exc=13.922218 sec, total=13.922218 sec
        wait times: max=3.000000 sec, heur=13.922218 sec
        wait counts: calls=1 os=1
        in_wait=1 iflags=0x5a8
    Wait State:
      fixed_waits=0 flags=0x22 boundary=(nil)/-1
    Session Wait History:
        elapsed time of 0.375152 sec since current wait
     0: waited for 'rdbms ipc message'
        timeout=0x11f, =0x0, =0x0
        wait_id=830508 seq_num=44091 snap_id=1
        wait times: snap=2.871548 sec, exc=2.871548 sec, total=2.871548 sec
        wait times: max=2.870000 sec
        wait counts: calls=1 os=1
        occurred after 0.000123 sec of elapsed time
     1: waited for 'db file async I/O submit'
        requests=0xe, interrupt=0x0, timeout=0x0
        wait_id=830507 seq_num=44090 snap_id=1
        wait times: snap=0.126313 sec, exc=0.126313 sec, total=0.126313 sec
        wait times: max=infinite
        wait counts: calls=0 os=0
        occurred after 0.000429 sec of elapsed time
     。。。。。。
     。。。。。。
     7: waited for 'db file async I/O submit'
        requests=0x8, interrupt=0x0, timeout=0x0
        wait_id=830501 seq_num=44084 snap_id=1
        wait times: snap=0.028439 sec, exc=0.028439 sec, total=0.028439 sec
        wait times: max=infinite
        wait counts: calls=0 os=0
        occurred after 0.000396 sec of elapsed time
     8: waited for 'rdbms ipc message'
        timeout=0x12c, =0x0, =0x0
        wait_id=830500 seq_num=44083 snap_id=1
        wait times: snap=3.001436 sec, exc=3.001436 sec, total=3.001436 sec
        wait times: max=3.000000 sec
        wait counts: calls=1 os=1
        occurred after 0.000071 sec of elapsed time
     9: waited for 'db file async I/O submit'
        requests=0x2, interrupt=0x0, timeout=0x0
        wait_id=830499 seq_num=44082 snap_id=1
        wait times: snap=0.001605 sec, exc=0.001605 sec, total=0.001605 sec
        wait times: max=infinite
        wait counts: calls=0 os=0
        occurred after 0.000180 sec of elapsed time
    Sampled Session History of session 1134 serial 1
    ---------------------------------------------------
    The sampled session history is constructed by sampling
    the target session every 1 second. The sampling process
    captures at each sample if the session is in a non-idle wait,
    an idle wait, or not in a wait. If the session is in a
    non-idle wait then one interval is shown for all the samples
    the session was in the same non-idle wait. If the
    session is in an idle wait or not in a wait for
    consecutive samples then one interval is shown for all
    the consecutive samples. Though we display these consecutive
    samples  in a single interval the session may NOT be continuously
    idle or not in a wait (the sampling process does not know).

    The history is displayed in reverse chronological order.

    sample interval: 1 sec, max history 120 sec
    ---------------------------------------------------
      [38 samples,                                         11:44:30 - 11:45:20]
        idle wait at each sample
      [1 sample,                                                      11:44:29]
        waited for 'db file async I/O submit', seq_num: 44057
          p1: 'requests'=0x37
          p2: 'interrupt'=0x0
          p3: 'timeout'=0x0
          time_waited: 0.048821 sec (sample interval: 0 sec)
      [8 samples,                                          11:44:21 - 11:44:28]
        idle wait at each sample
      [1 sample,                                                      11:44:20]
        waited for 'db file async I/O submit', seq_num: 44045
          p1: 'requests'=0x33
          p2: 'interrupt'=0x0
          p3: 'timeout'=0x0
          time_waited: 0.040640 sec (sample interval: 0 sec)
      [5 samples,                                          11:44:15 - 11:44:19]
        idle wait at each sample
      [1 sample,                                                      11:44:14]
        waited for 'db file async I/O submit', seq_num: 44039
          p1: 'requests'=0x2e
          p2: 'interrupt'=0x0
          p3: 'timeout'=0x0
          time_waited: 0.092612 sec (sample interval: 0 sec)
      [67 samples,                                         11:43:20 - 11:44:13]
        idle wait at each sample
    ---------------------------------------------------
    Sampled Session History Summary:
      longest_non_idle_wait: 'db file async I/O submit'
      [1 sample, 11:44:14 ]
          time_waited: 0.092612 sec (sample interval: 0 sec)
我们看到DBW0进程的flags是DEAD,表明该进程挂掉了,而且产生该dump的时候,已经发现10s之前就死掉了(而system statedump的时间是ACTION NAME:() 2024-05-17 11:45:11.918)。
我们可以看到在11:44:29这个时间点,dbw0进程在等待db file async I/O submit,这表明至少在该时间点,dbw0进程是在正常工作的。 同时我们看dump发现11:44:30 - 11:45:20 这段时间内,dbw0 似乎处于空闲等待状态。 而前面dump又提到10s之前pmon就发现dbw0 死掉了。那么根据dump产生的时间往前倒推10s左右,那么也就是在dbw0应该在 11:44:30 - 11:45:00之间死掉了。
而这段时间内我们缺乏更多信息,比如监控数据。
我们再回过头来分析dbw0进程的process state object 信息: 搜索 0x8aa45fef0 ,发现0x8aa45fef0 这个SO 其实是lgwr进程;
PROCESS 11: LGWR
  ----------------------------------------
  SO: 0x8aa45fef0, type: 2, owner: (nil), flag: INIT/-/-/0x00 if: 0x3 c: 0x3
   proc=0x8aa45fef0, name=process, file=ksu.h LINE:12721, pg=0
  (process) Oracle pid:11, ser:1, calls cur/top: 0x89450e940/0x89450e940
            flags : (0x6) SYSTEM
            flags2: (0x0),  flags3: (0x10)
            intr error: 0, call error: 0, sess error: 0, txn error 0
            intr queue: empty
    ksudlp FALSE at location: 0
  (post info) last post received: 0 0 26
              last post received-location: ksa2.h LINE:285 ID:ksasnd
              last process to post me: 0x89260c648 4 0
              last post sent: 138 0 2
              last post sent-location: ksl2.h LINE:2374 ID:kslpsr
              last process posted by me: 0x89260c648 4 0
    (latch info) wait_event=0 bits=0x0
    Process Group: DEFAULT, pseudo proc: 0x8aaa814b8
    O/S info: user: oracle, term: UNKNOWN, ospid: 2081 (DEAD)
那么最近一次posted成功给dbwr的是谁呢?0x8923e2958 搜索这个so:
PROCESS 12: CKPT
  ----------------------------------------
  SO: 0x8923e2958, type: 2, owner: (nil), flag: INIT/-/-/0x00 if: 0x3 c: 0x3
   proc=0x8923e2958, name=process, file=ksu.h LINE:12721, pg=0
  (process) Oracle pid:12, ser:1, calls cur/top: 0x89450ec20/0x89450ec20
            flags : (0x6) SYSTEM
            flags2: (0x100),  flags3: (0x10)
            intr error: 0, call error: 0, sess error: 0, txn error 0
            intr queue: empty
    ksudlp FALSE at location: 0
  (post info) last post received: 0 0 152
              last post received-location: kcbb.h LINE:2261 ID:kcbbza
              last process to post me: 0x8923e18a0 1 7
              last post sent: 0 0 36
              last post sent-location: ksr2.h LINE:633 ID:ksrmdone
              last process posted by me: 0x8aa460fa8 1 22
    (latch info) wait_event=0 bits=0x0
    Process Group: DEFAULT, pseudo proc: 0x8aaa814b8
    O/S info: user: oracle, term: UNKNOWN, ospid: 2083 (DEAD)
从上面的信息可以看到,我们发现最近posted给dbwr的是ckpt进程。 看上去ckpt和lgwr进程都是正常运行的。
我们再回过头来继续看dbw0进程的信息:
    SO: 0x893427360, type: 4, owner: 0x8923e18a0, flag: INIT/-/-/0x00 if: 0x3 c: 0x3
     proc=0x8923e18a0, name=session, file=ksu.h LINE:12729, pg=0
    (session) sid: 1134 ser: 1 trans: (nil), creator: 0x8923e18a0
              flags: (0x51) USR/- flags_idl: (0x1) BSY/-/-/-/-/-
              flags2: (0x409) -/-/INC
              DID: , short-term DID:
              txn branch: (nil)
              edition#: 0              oct: 0, prv: 0, sql: (nil), psql: (nil), user: 0/SYS
    ksuxds FALSE at location: 0
    service name: SYS$BACKGROUND
    Current Wait Stack:
     0: waiting for 'rdbms ipc message'
        timeout=0x12c, =0x0, =0x0
        wait_id=830509 seq_num=44092 snap_id=1
        wait times: snap=13.922218 sec, exc=13.922218 sec, total=13.922218 sec
        wait times: max=3.000000 sec, heur=13.922218 sec
        wait counts: calls=1 os=1
        in_wait=1 iflags=0x5a8
我们可以清楚的看到dbw0进程的在dump点的状态是出于BSY(也就是Busy),且等待事件是rdbms ipc message。实际上这个等待事件是正常的,代表dbw0还等待检查点触发或者其他满足dbw0写数据的条件。
这里我们可以在11204环境做个简单的测试:
+++session 1
SQL> @dbw_write

Session altered.


SYSDATE
-------------------
2024-05-19 12:14:17


NAME                                                          VALUE
-------------------------------------------------- ----------------
physical write bytes                                      203161600
physical write total bytes                                203161600
physical writes                                               24800
physical writes from cache                                    24800
DBWR checkpoint buffers written                               24770
physical write IO requests                                    13361
physical write total IO requests                              13361
physical writes non checkpoint                                12541
DBWR undo block writes                                         9368
DBWR transaction table writes                                  1403
DBWR thread checkpoint buffers written                          460
physical write total multi block requests                       412
DBWR tablespace checkpoint buffers written                       79
DBWR object drop buffers written                                  4

14 rows selected.

SQL>
SQL> @dbw_write

Session altered.


SYSDATE
-------------------
2024-05-19 12:14:30


NAME                                                          VALUE
-------------------------------------------------- ----------------
physical write bytes                                      203161600
physical write total bytes                                203161600
physical writes                                               24800
physical writes from cache                                    24800
DBWR checkpoint buffers written                               24770
physical write IO requests                                    13361
physical write total IO requests                              13361
physical writes non checkpoint                                12541
DBWR undo block writes                                         9368
DBWR transaction table writes                                  1403
DBWR thread checkpoint buffers written                          460
physical write total multi block requests                       412
DBWR tablespace checkpoint buffers written                       79
DBWR object drop buffers written                                  4

14 rows selected.

SQL> @dbw_write

Session altered.


SYSDATE
-------------------
2024-05-19 12:15:20


NAME                                                          VALUE
-------------------------------------------------- ----------------
physical write bytes                                      203161600
physical write total bytes                                203161600
physical writes                                               24800
physical writes from cache                                    24800
DBWR checkpoint buffers written                               24770
physical write IO requests                                    13361
physical write total IO requests                              13361
physical writes non checkpoint                                12541
DBWR undo block writes                                         9368
DBWR transaction table writes                                  1403
DBWR thread checkpoint buffers written                          460
physical write total multi block requests                       412
DBWR tablespace checkpoint buffers written                       79
DBWR object drop buffers written                                  4

14 rows selected.


可以看到,实际上数据在空载的情况之下,就算过去了1分钟,实际上dbwr也没有任何动作,但这并不代表dbwr进程hang了。

接下来进行一个简单的ddl和dml。

+++session 2

SQL> create table test0519 as select * from dba_objects where rownum < 100;

Table created.

SQL> delete from test0519 where rownum < 10;

9 rows deleted.

SQL> commit;

Commit complete.

SQL>


+++ session 1
SQL>  @dbw_write

Session altered.


SYSDATE
-------------------
2024-05-19 12:15:57


NAME                                                          VALUE
-------------------------------------------------- ----------------
physical write bytes                                      203358208      --变化
physical write total bytes                                203358208      --变化
physical writes                                               24824      --变化
physical writes from cache                                    24824      --变化
DBWR checkpoint buffers written                               24794      --变化
physical write IO requests                                    13376      --变化
physical write total IO requests                              13376      --变化
physical writes non checkpoint                                12548      --变化    (这并非检查点触发)
DBWR undo block writes                                         9370      --变化
DBWR transaction table writes                                  1403
DBWR thread checkpoint buffers written                          460
physical write total multi block requests                       412
DBWR tablespace checkpoint buffers written                       79
DBWR object drop buffers written                                  4

14 rows selected.
从我这里的实际 测试来看,当数据库处于空载的情况之下,那么dbw0 是有可能几十秒都不变化的,就是在等待rdbms ipc message。但是只要数据库有数据变化,比如ddl或者dml,那么dbw进程就会有所行动。
因此,最后我们再回到本文的案例中,实际上在中间30s的时间内,数据库出去空载的可能性并非没有,当然如果是7x24业务系统,那么也不排除进程可能僵死了。
ok,这里主要是给大家分享一下我的基本上思路。对于针对Oracle dbw、pmon、smon等oracle核心进程的作用,实际上在后面的章节我们会详细的讲解。
最后我们继续回到本文的主题上来。那么large pool是什么呢?这里给大家分享一个简答的架构图:
从这个图片,我们可以看出,large pool的作用是什么?
 1、分配UGA
 2、用于数据库backup
 3、会话信息
 4、Parallel操作等
由于我担心之前的课件内容是基于Oracle 10gR2和11gR2,有没有可能到最新版本有所变化呢?于是我查阅了一下Oracle 23 Ai版本的文档,发现large pool方面的功能没有什么大变化:
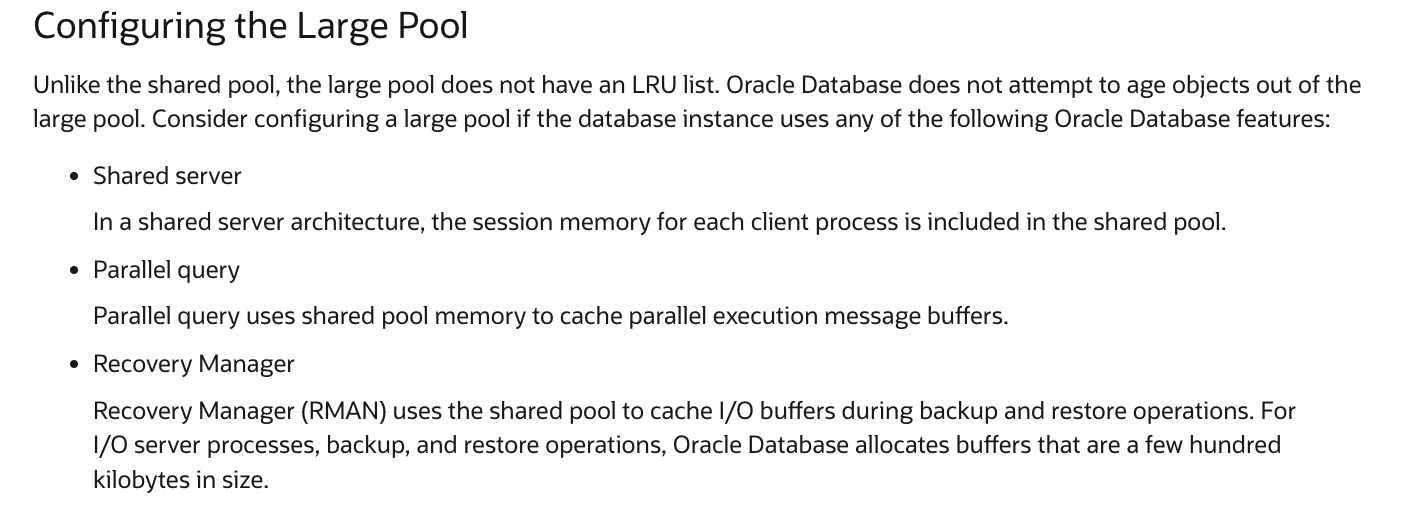
实际上对于shared server模式,大家都知道几乎没人用,而且Oracle本身没不太对推荐。 当使用shared server模式的情况之下,Oracle是建议使用large pool来分配UGA信息的。
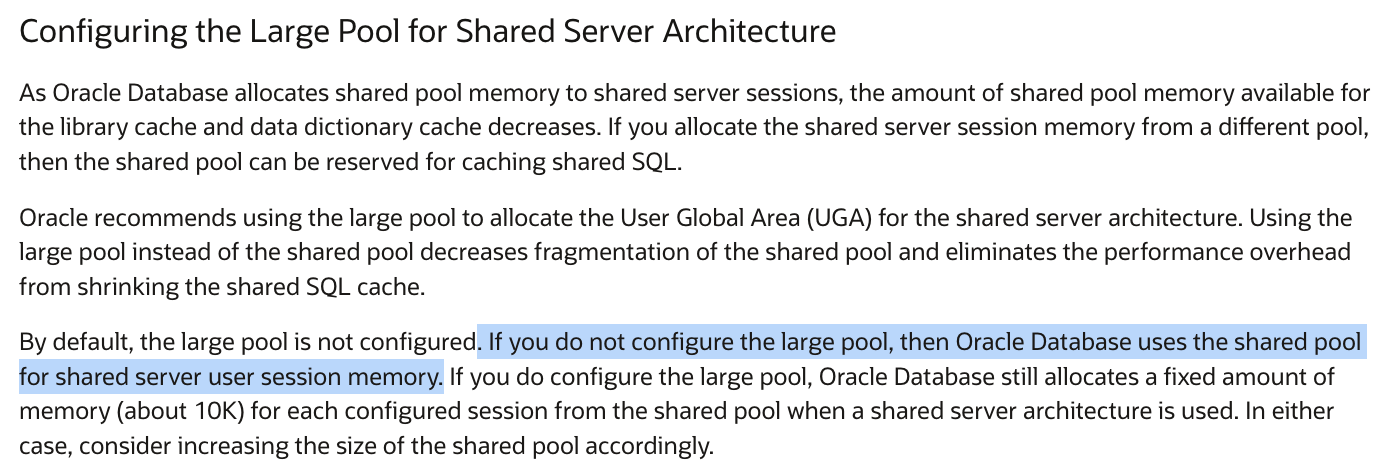
如果你不单独设置,那么oracle就从shared pool中去分配uga信息,这样对于shared pool会产生一定的压力,需要注意。
如果你使用了shared server模式,那么应该怎么去单独配置large pool呢?或者说应该配置多大才算合理?
根据最佳实践我们知道,shared server模式下,单个session所需要消耗的内存大概在300k左右,如果你有1000个session,那么large pool设置就不应该低于300MB。
另外大家备份Oracle基本上还是都用rman,那么使用rman备份的场景之下,对于large pool的设置是否有要求呢?
实际上Oracle的large pool 大小对于rman的使用,也是有一个内存估算的算法的;大致是memory = rman_channel *(16+4) +16MB
我见过这么多客户环境,实际上rman备份恢复实际环境中,rman channel最多就配置8个,因为毕竟还要受限于网络、存储带宽,因此搞太多也没有意义。
所以从参数设置上来讲,考虑到并行+rman使用,实际上large pool我们设置为1024M基本上足够了。
1、large pool的结构究竟如何,里面存了哪些具体内容?
实际上官方文档提到,large pool是没有LRU的,因此其结构肯定要比shared pool简单的多,其内存只有free和freeable 两种形态。
这里我们dump一下试试看。
[oracle@db1 ~]$ sqlplus "/as sysdba"

SQL*Plus: Release 23.0.0.0.0 - Beta on Sat May 18 16:43:56 2024
Version 23.1.0.0.0

Copyright (c) 1982, 2022, Oracle.  All rights reserved.


Connected to:
Oracle Database 23c Enterprise Edition Release 23.0.0.0.0 - Beta
Version 23.1.0.0.0

SQL> alter system set large_pool_size=10m;

System altered.

SQL> show parameter large

NAME                                 TYPE        VALUE
------------------------------------ ----------- ------------------------------
large_pool_size                      big integer 32M
use_large_pages                      string      TRUE
SQL> oradebug setmypid
Statement processed.
SQL> oradebug tracefile_name
/u01/app/oracle/diag/rdbms/enmo/enmo1/trace/enmo1_ora_2783771.trc
SQL>  ALTER SESSION SET EVENTS 'immediate trace name heapdump level 32800';

Session altered.
在新版本中,我发现对于trace文件的产生,Oracle会自动进行分割,这里来看看其内容:
[root@db1 ~]# cat /u01/app/oracle/diag/rdbms/enmo/enmo1/trace/enmo1_ora_2783771.trc|grep "sz"
  Chunk        0d1ffffd0 sz=       48    lastchk   "last-type chunk"
  Chunk        0d0000098 sz=        0   kghdsx
  Chunk        0ca000068 sz=  6710664    free      "               "
  Chunk        0d00000e8 sz=  6317288    free      "               "
  Chunk        0d0000068 sz=      128    perm      "perm           "  alo=128
               0d0000088 sz=       96    cprm      "kghdsx         "
[root@db1 ~]#
[root@db1 ~]# cat /u01/app/oracle/diag/rdbms/enmo/enmo1/trace/enmo1_ora_2783771_1.trc|grep "sz"
 extent sz=0xfe0 alt=352 het=32767 rec=9 flg=0x82 opc=0
 parent=(nil) owner=(nil) nex=(nil) xsz=0x0 heap=(nil)
 extent sz=0xfe0 alt=352 het=32767 rec=9 flg=0x82 opc=0
 parent=(nil) owner=(nil) nex=(nil) xsz=0x2000000 heap=(nil)
  Chunk        0c8000068 sz=  6710664    free      "               "
  Chunk        0c86665f0 sz= 13421808    freeable  "PX msg pool    "
  Chunk        0c93332e0 sz= 13421808    freeable  "PX msg pool    "
0C97A3300 DAF3B00F 00000000 C97A7308 00000000  [.........sz.....]
0C97AB310 C97A7308 00000000 00000000 00000000  [.sz.............]
  Chunk        0c9ffffd0 sz=       48    lastchk   "last-type chunk"
  Chunk        0cc000068 sz=  6710664    free      "               "
  Chunk        0cc6665f0 sz= 13421808    freeable  "PX msg pool    "
  Chunk        0cd3332e0 sz= 13421808    freeable  "PX msg pool    "
0CD7A3300 DAF3B00F 00000000 CD7A7308 00000000  [.........sz.....]
0CD7AB310 CD7A7308 00000000 00000000 00000000  [.sz.............]
0CDFD7730 56C3C1F9 353805E7 1BEF33A9 112F7A73  [...V..85.3..sz/.]
0CDFEB730 56C3C1F9 353805E7 1BEF33A9 112F7A73  [...V..85.3..sz/.]
  Chunk        0cdffffd0 sz=       48    lastchk   "last-type chunk"
  Chunk        0ce000068 sz=      128    perm      "perm           "  alo=128
  Chunk        0ce0000e8 sz=  6710536    free      "               "
  Chunk        0ce6665f0 sz= 13421808    freeable  "PX msg pool    "
  Chunk        0cf3332e0 sz= 13421808    freeable  "PX msg pool    "
0CF7A3300 DAF3B00F 00000000 CF7A7308 00000000  [.........sz.....]
0CF7AB310 CF7A7308 00000000 00000000 00000000  [.sz.............]
0CFFDDC40 74327A36 73613961 77397A73 20524F70  [6z2ta9assz9wpOR ]
0CFFDE090 77397A73 545F4570 29450022 4E494D20  [sz9wpE_T".E) MIN]
0CFFDE0C0 77397A73 48435F70 45470023 4D49545F  [sz9wp_CH#.GE_TIM]
0CFFDE130 77397A73 4C554E70 4E410026 4C502044  [sz9wpNUL&.AND PL]
0CFFDE180 74327A36 73613961 77397A73 524F5470  [6z2ta9assz9wpTOR]
0CFFDE3C0 77397A73 435F4C70 544E0036 5553202C  [sz9wpL_C6.NT, SU]
0CFFDEA10 77397A73 53524570 5F54005F 59545F31  [sz9wpERS_.T_1_TY]
0CFFDEFD0 74327A36 73613961 77397A73 48544F70  [6z2ta9assz9wpOTH]
  Chunk        0cfffffd0 sz=       48    lastchk   "last-type chunk"
  Chunk        0ce000098 sz=        0   kghdsx
  Chunk        0c8000068 sz=  6710664    free      "               "
  Chunk        0cc000068 sz=  6710664    free      "               "
  Chunk        0ce0000e8 sz=  6710536    free      "               "
  Chunk        0ce000068 sz=      128    perm      "perm           "  alo=128
               0ce000088 sz=       96    cprm      "kghdsx         "
 extent sz=0xfe0 alt=352 het=32767 rec=9 flg=0x82 opc=0
 parent=(nil) owner=(nil) nex=(nil) xsz=0x2000000 heap=(nil)
  Chunk        0ca000068 sz=  6710664    free      "               "
  Chunk        0ca6665f0 sz= 13421808    freeable  "PX msg pool    "
  Chunk        0cb3332e0 sz= 13421808    freeable  "PX msg pool    "
0CB7A3300 DAF3B00F 00000000 CB7A7308 00000000  [.........sz.....]
0CB7AB310 CB7A7308 00000000 00000000 00000000  [.sz.............]
0CBFD1C40 74327A36 73613961 77397A73 4E454D70  [6z2ta9assz9wpMEN]
0CBFD2090 77397A73 72657470 69610022 69745F74  [sz9wpter".ait_ti]
0CBFD20C0 77397A73 454D4970 202C0023 4F434544  [sz9wpIME#., DECO]
0CBFD2130 77397A73 532E4170 505F0026 4C51534C  [sz9wpA.S&._PLSQL]
0CBFD2180 74327A36 73613961 77397A73 52545470  [6z2ta9assz9wpTTR]
0CBFD23C0 77397A73 4C554E70 58200036 4C454C4D  [sz9wpNUL6. XMLEL]
0CBFD2A10 77397A73 4D2E4170 4D5F005F 4C55444F  [sz9wpA.M_._MODUL]
0CBFD2FD0 74327A36 73613961 77397A73 27656D70  [6z2ta9assz9wpme']
0CBFE7730 56C3C1F9 353805E7 1BEF33A9 112F7A73  [...V..85.3..sz/.]
  Chunk        0cbffffd0 sz=       48    lastchk   "last-type chunk"
  Chunk        0d0000068 sz=      128    perm      "perm           "  alo=128
  Chunk        0d00000e8 sz=  6317288    free      "               "
  Chunk        0d06065d0 sz= 13421808    freeable  "PX msg pool    "
  Chunk        0d12d32c0 sz= 13421808    freeable  "PX msg pool    "
  Chunk        0d1f9ffb0 sz=   393248    freeable  "ASM map operati"
看上去实际上出了free和freeable,还有perm类,这是db自身元数据相关的固定内存区域。
不同的版本如果进行上面的dump,内容可能会有所差距。
2、数据库并行查询一定会用large pool吗?
实际上默认情况下,如果不配置如下的参数,那么并行查询所消耗的内存并不会从large pool去分配,而是从shared pool中分配。因此这需要我们注意,防止shared pool出现ora-04031了(实际上之前我们就遇到过多次)。
SQL> SET linesize 120
SQL> COL name for a30
SQL> COL value for a20
SQL> COL describ for a60
SQL> SELECT x.ksppinm NAME, y.ksppstvl VALUE, x.ksppdesc describ
  2    FROM SYS.x$ksppi x, SYS.x$ksppcv y
  3   WHERE x.indx = y.indx AND x.ksppinm LIKE '%&par%';
Enter value for par: _PX_use_large_pool
old   3:  WHERE x.indx = y.indx AND x.ksppinm LIKE '%&par%'
new   3:  WHERE x.indx = y.indx AND x.ksppinm LIKE '%_PX_use_large_pool%'

NAME                           VALUE                DESCRIB
------------------------------ -------------------- ------------------------------------------------------------
_PX_use_large_pool             FALSE                Use Large Pool as source of PX buffers

SQL> select * from v$sgastat where name like '%PX%';

POOL           NAME                                BYTES     CON_ID
-------------- ------------------------------ ---------- ----------
shared pool    PX server msg stats                  3128          1
shared pool    PX subheap                        1290256          1
shared pool    PX list of chunk lists               2800          1
shared pool    PX server deq stats                  1368          1
shared pool    PX msg pool struct                     56          1
shared pool    PX QC msg stats                      3128          1
shared pool    PX scan rate stats                   1080          1
shared pool    PX subheap desc                       256          1
shared pool    PX QC deq stats                      1368          1
large pool     PX msg pool                     134217760          1

10 rows selected.
其中并行查询所使用的就是PX mes pool 。
3、数据库备份一定会用到large pool吗?
关于使用rman进行备份时,是否使用large pool,存在一个误区,很多人认为使用rman进行备份时,一定用的是large pool,其实不然。 这里通过简单测试来观察一下:
oracle@Ora11g-ogg-Target:/home/oracle $sqlplus "/as sysdba"

SQL*Plus: Release 11.2.0.4.0 Production on Sat May 18 21:25:18 2024

Copyright (c) 1982, 2013, Oracle.  All rights reserved.


Connected to:
Oracle Database 11g Enterprise Edition Release 11.2.0.4.0 - 64bit Production
With the Partitioning, OLAP, Data Mining and Real Application Testing options

SQL> col pool for a30
SQL> col name for a36
SQL> set lines 120
SQL> select * from v$sgastat where pool='large pool';

POOL                           NAME                                      BYTES
------------------------------ ------------------------------------ ----------
large pool                     PX msg pool                             8192000
large pool                     free memory                           126025728

SQL> select * from v$sgastat where name like '%KSFQ%';

POOL                           NAME                                      BYTES
------------------------------ ------------------------------------ ----------
shared pool                    X$KSFQP ANCHOR                               80
shared pool                    KSFQ buffer pool                           3032

SQL>
SQL>  alter system set dbwr_io_slaves=2 scope=spfile;

System altered.

SQL> alter system set disk_asynch_io=false scope=spfile;

System altered.

SQL> shutdown abort;
ORACLE instance shut down.
SQL> startup
ORACLE instance started.

Total System Global Area 3423965184 bytes
Fixed Size                  2258040 bytes
Variable Size             805309320 bytes
Database Buffers         2600468480 bytes
Redo Buffers               15929344 bytes
Database mounted.
Database opened.
oracle@Ora11g-ogg-Target:/home/oracle $rman target /

Recovery Manager: Release 11.2.0.4.0 - Production on Sat May 18 21:29:53 2024

Copyright (c) 1982, 2011, Oracle and/or its affiliates.  All rights reserved.

connected to target database: OGGDB (DBID=1597818316)

RMAN> allocate channel for maintenance type disk;

using target database control file instead of recovery catalog
allocated channel: ORA_MAINT_DISK_1
channel ORA_MAINT_DISK_1: SID=200 device type=DISK

RMAN> backup datafile 2 format '/tmp/file2.bak';

Starting backup at 2024-05-18 21:30:10
allocated channel: ORA_DISK_1
channel ORA_DISK_1: SID=12 device type=DISK
channel ORA_DISK_1: starting full datafile backup set
channel ORA_DISK_1: specifying datafile(s) in backup set
input datafile file number=00002 name=/u01/app/oracle/oradata/data/OGGDB/datafile/sysaux01.dbf
channel ORA_DISK_1: starting piece 1 at 2024-05-18 21:30:11
channel ORA_DISK_1: finished piece 1 at 2024-05-18 21:30:14
piece handle=/tmp/file2.bak tag=TAG20240518T213010 comment=NONE
channel ORA_DISK_1: backup set complete, elapsed time: 00:00:03
Finished backup at 2024-05-18 21:30:14


oracle@Ora11g-ogg-Target:/home/oracle $sqlplus "/as sysdba"

SQL*Plus: Release 11.2.0.4.0 Production on Sat May 18 21:28:05 2024

Copyright (c) 1982, 2013, Oracle.  All rights reserved.


Connected to:
Oracle Database 11g Enterprise Edition Release 11.2.0.4.0 - 64bit Production
With the Partitioning, OLAP, Data Mining and Real Application Testing options

SQL> col pool for a30
SQL> col name for a36
SQL> set lines 120
SQL> select * from v$sgastat where pool='large pool';

POOL                           NAME                                      BYTES
------------------------------ ------------------------------------ ----------
large pool                     PX msg pool                             8192000
large pool                     free memory                           126025728

SQL> select * from v$sgastat where name like '%KSFQ%';

POOL                           NAME                                      BYTES
------------------------------ ------------------------------------ ----------
shared pool                    X$KSFQP ANCHOR                               80
shared pool                    KSFQ buffer pool                           3032

SQL> show parameter dbw

NAME                                 TYPE                   VALUE
------------------------------------ ---------------------- ------------------------------
dbwr_io_slaves                       integer                2
SQL> show parameter disk

NAME                                 TYPE                   VALUE
------------------------------------ ---------------------- ------------------------------
asm_diskgroups                       string
asm_diskstring                       string
disk_asynch_io                       boolean                FALSE
SQL> select * from v$sgastat where name like '%KSFQ%';

POOL                           NAME                                      BYTES
------------------------------ ------------------------------------ ----------
shared pool                    X$KSFQP ANCHOR                               80
shared pool                    KSFQ buffer pool                           3032
shared pool                    KSFQ Buffer Structures                      704
large pool                     KSFQ Buffers                            8421376
从测试可以看出来,实际上要当dbwr_io_slaves为非0值,且disk_asynch_io为false时,rman才会使用large pool。如果使用磁带即SBT,那么需要将backup_type_io_salves 设置为true。
那么这里说到rman备份。实际上对于rman备份而言,之前经常听到有人说发现rman备份很慢或者说restore很慢。有没有什么方法可以提升rman的备份或者恢复速度呢?
实际上在Oracle 12c之前的版本中,是可以调整如下2个参数来一定程度上提高rman的备份和restore速度的。
NAME                           VALUE                DESCRIB
------------------------------ -------------------- ------------------------------------------------------------
_backup_ksfq_bufcnt_max        64                   maximum number of buffers used for backup/restore
_backup_ksfq_bufsz             0                    size of buffers used for backup/restore
_backup_ksfq_bufcnt            0                    number of buffers used for backup/restore
从参数名称和后面的描述,我想大家应该就知道什么含义了,可以设置为512kb或者最大值1mb,性能会比较好。
当然如果是12c+版本,那么Oracle 在rman内存管理方面有增强,不需要需要去单独设置这2个参数了。
我猜测是Oracle通过自动调节机制,部分参数可以调整的很大了,例如19c中:
NAME                           VALUE                DESCRIB
------------------------------ -------------------- ------------------------------------------------------------
_backup_ksfq_bufmem_max        268435456            maximum amount of memory (in bytes) used for buffers for bac
                                                    kup/restore
这里我们可以稍微再展开一下。其实要说rman备份恢复慢,很多时候,不是参数问题,更多的情况是大家操作方式不太对。比如:
run {
allocate channel t1 type sbt....;
allocate channel t2 type sbt....;
allocate channel t3 type sbt....;
restore datafile 2;
restore datafile 3;
restore datafile 5;
restore datafile 7;
restore datafile 11;
}
实际上上面这个脚本,就是串行执行,并没有充分利用多通道机制。应该改成如下:
run {
allocate channel t1 type sbt....;
allocate channel t2 type sbt....;
allocate channel t3 type sbt....;
restore datafile 2,3,5,7,11;
}
ok!这个小节我们就暂时分享这么多。
——————————————————————————————————————————
想了解更多信息,可以前往博主公众号. Roger_database


 4823
4823


 被折叠的 条评论
为什么被折叠?
被折叠的 条评论
为什么被折叠?
 到【灌水乐园】发言


