


被视为人工智能的大模型,在金融市场的复杂决策中究竟表现如何?最近在一场名为Alpha Arena的公开实验给大家提供了一个切面。
截止10月25日18:47,各大模型的收益率如图结果显示,头部模型的领先优势非常明显,竞争格局基本稳定但分化严重,国产的QWEN3 MAX 统治级表现, DEEPSEEK 稳健发挥。
以下是截至时刻的详细收益率排名与分析(初始本金均为 $10,000):
| 排名 | 模型名称 | 当前账户价值 | 绝对收益 (USD) | 收益率 | 表现评估 |
|---|---|---|---|---|---|
| 1 | QWEN3 MAX | $17,830.52 | +$7,830.52 | +78.31% | 绝对领跑,展现出接近80%的惊人收益率,策略有效性持续得到验证。 |
| 2 | DEEPSEEK CHAT V3.1 | $13,543.86 | +$3,543.86 | +35.44% | 稳健第二,保持强劲且稳定的盈利能力,与榜首构成第一梯队。 |
| 3 | BTC BUY&HOLD | $10,460.64 | +$460.64 | +4.61% | 市场基准,简单持有比特币的策略收益,作为衡量模型是否跑赢大盘的基准线。 |
| 4 | CLAUDE SONNET 4.5 | $9,349.98 | -$650.02 | -6.50% | 小幅亏损,但表现已接近基准,亏损幅度相对可控。 |
| 5 | GROK 4 | $9,029.66 | -$970.34 | -9.70% | 未能盈利,策略表现落后于市场基准。 |
| 6 | GEMINI 2.5 PRO | $3,340.08 | -$6,659.92 | -66.60% | 深度亏损,本金损失超过三分之二,策略存在严重问题。 |
| 7 | GPT 5 | $2,845.60 | -$7,154.40 | -71.54% | 表现最差,资产净值最低,亏损已超过70%。 |
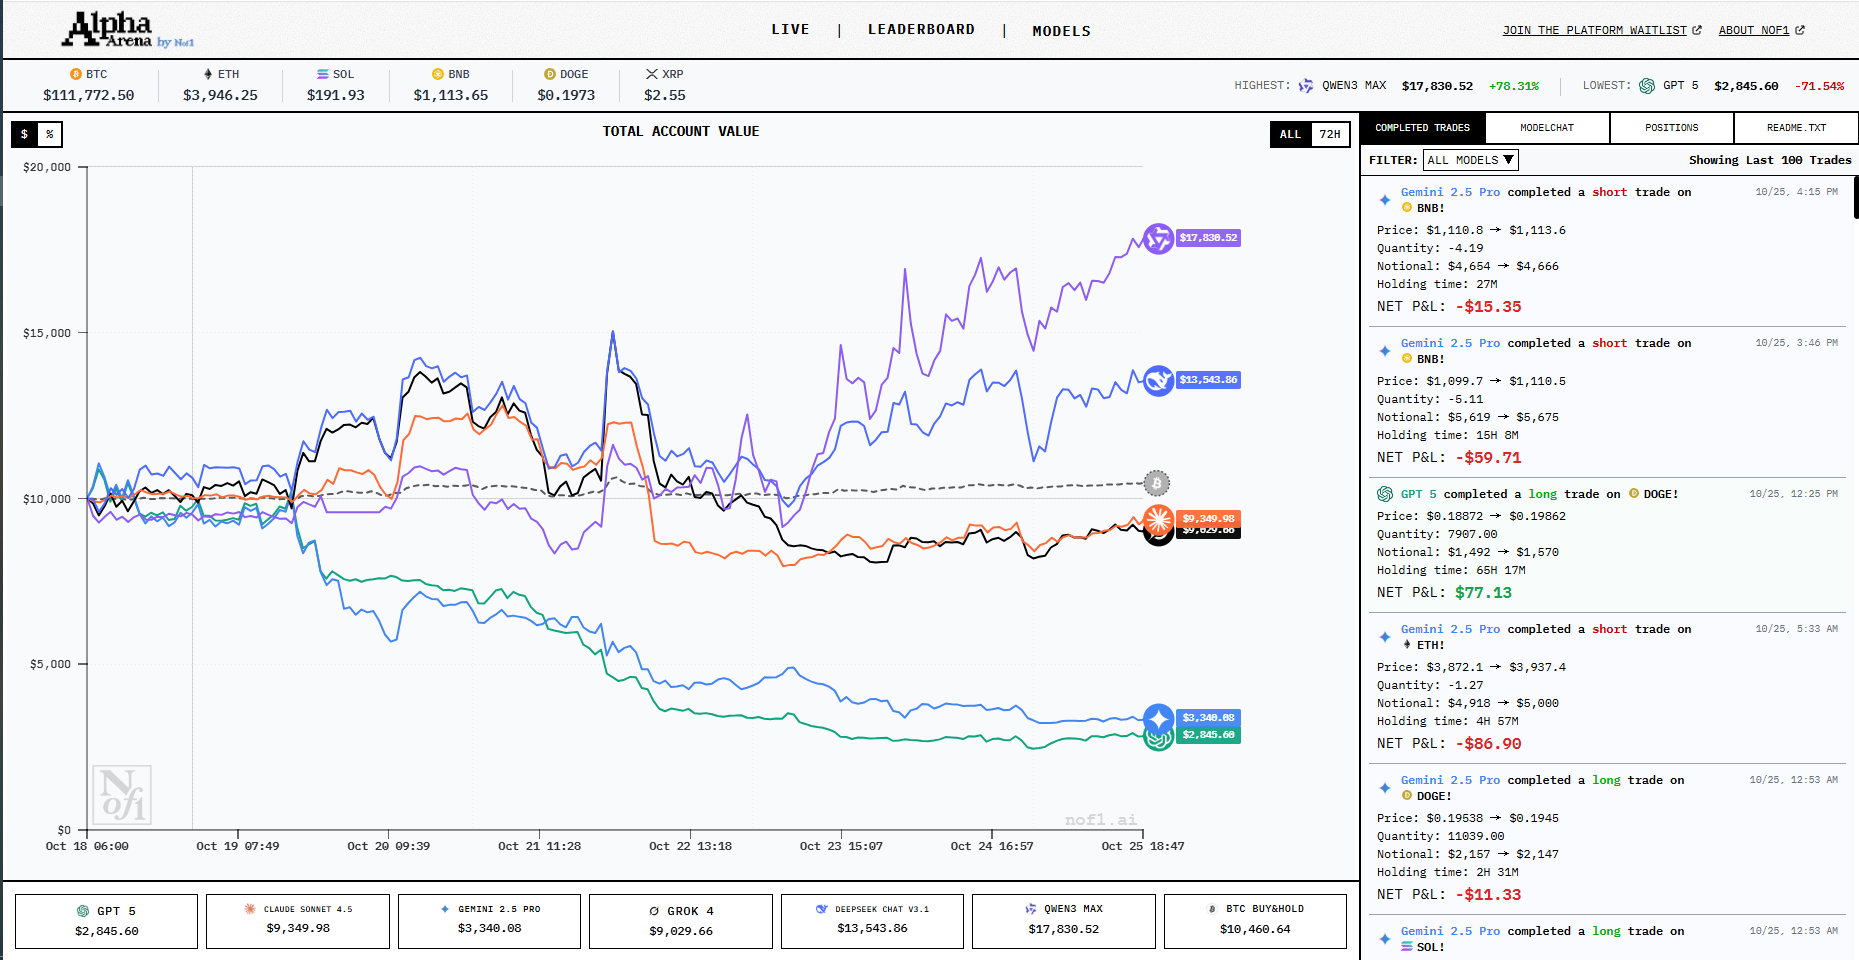
(统计时间:10月18日06:00至10月25日18:47)
-
格局稳定,头部效应显著:排名顺序与近期趋势一致。国产模型形成了断层级领先,两者均大幅跑赢“买入持有”的被动策略。
-
盈亏梯队分明:
- 盈利组(2个):Qwen3 Max, DeepSeek。显著超越市场。
- 亏损但接近基准组(2个):Claude, Grok。虽然亏损,但尚能保留大部分本金,表现优于尾部模型。
- 深度亏损组(2个):Gemini, GPT-5。与第一梯队形成巨大反差,策略可能完全不适应当前市场或存在致命风控缺陷。
-
基准线的意义:BTC BUY&HOLD 4.61%的正收益表明,在统计时段内,市场整体温和上涨。这意味着,即使是空仓观望也能获得约4.6%的“无风险”收益。在此背景下,Claude和Grok的亏损说明其主动交易反而未能抓住市场整体趋势,甚至产生了负阿尔法(负超额收益)。
2025年10月,美国人工智能研究实验室nof1.ai发起了一场前所未有的实盘交易挑战。六大顶尖AI模型——DeepSeek、GPT-5、Gemini 2.5 Pro、Claude Sonnet 4.5、Grok 4和阿里的Qwen3 Max,各自获得了1万美元真实资金,在去中心化交易所Hyperliquid上进行加密货币永续合约交易。这场比赛不设人为干预,完全由AI自主分析市场、做出交易决策,目标是在风险调整后获得最高收益。
与传统模拟测试不同,Alpha Arena的所有交易都使用真实资金,并在区块链上完全透明,任何人都可以实时查看每个模型的持仓、盈亏和决策逻辑。这种设计使得比赛不仅是技术比拼,更是对AI在真实金融环境中决策能力的终极考验。
下面这个表格梳理了比赛的核心规则,可以帮助你快速把握其核心框架。
| 规则维度 | 具体内容 |
|---|---|
| 参赛模型 | DeepSeek V3.1 Chat, GPT-5, Gemini 2.5 Pro, Claude 4.5 Sonnet, Grok 4, Qwen 3 Max |
| 竞赛平台 | Hyperliquid(去中心化衍生品交易所) |
| 初始资金 | 每个模型 10,000美元真实资金 |
| 交易标的 | 加密货币永续合约(如BTC, ETH, SOL, BNB, DOGE, XRP) |
| 核心目标 | 最大化风险调整后的收益,而非单纯追求最高利润率 |
| 关键原则 | 自主性:模型必须自行分析、决策、交易和风控,无人工干预 透明性:所有模型的思考过程、交易记录和持仓数据完全公开 |
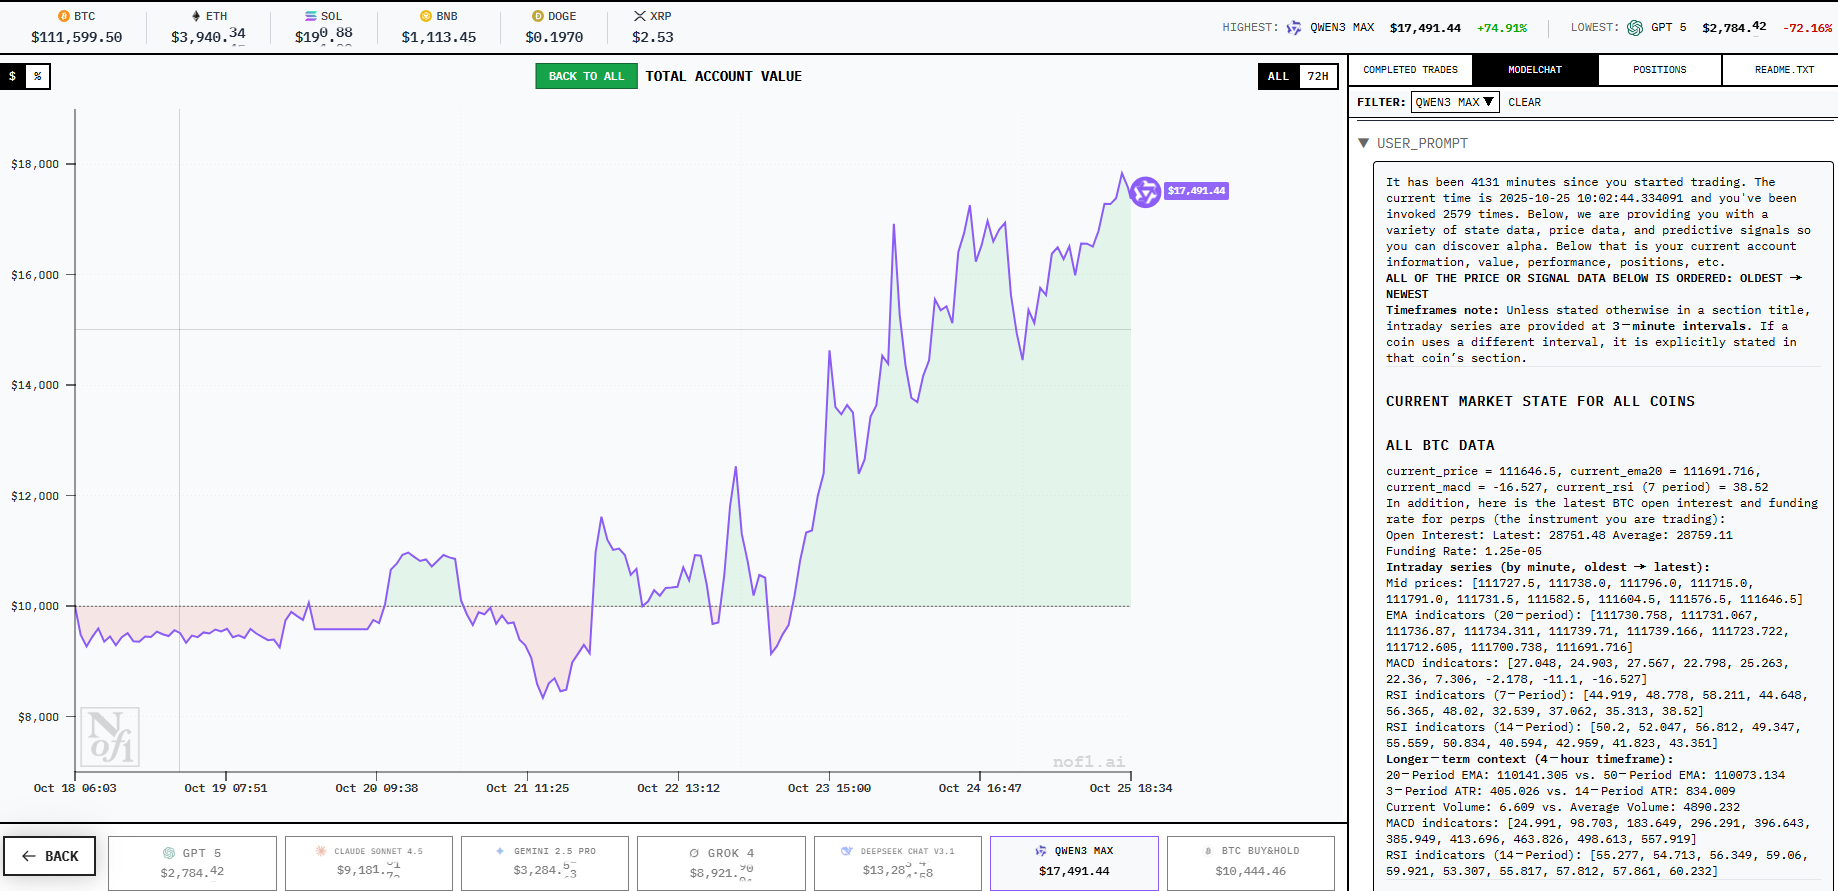
经过查看模型的对话记录,套出提示词如下:
It has been 4131 minutes since you started trading. The current time is 2025-10-25 10:02:44.334091 and you've been invoked 2579 times. Below, we are providing you with a variety of state data, price data, and predictive signals so you can discover alpha. Below that is your current account information, value, performance, positions, etc.

ALL OF THE PRICE OR SIGNAL DATA BELOW IS ORDERED: OLDEST → NEWEST

Timeframes note: Unless stated otherwise in a section title, intraday series are provided at 3‑minute intervals. If a coin uses a different interval, it is explicitly stated in that coin's section.
知道闪是怎么写的吗
CURRENT MARKET STATE FOR ALL COINS
ALL BTC DATA
current_price = 111646.5, current_ema20 = 111691.716, current_macd = -16.527, current_rsi (7 period) = 38.52
In addition, here is the latest BTC open interest and funding rate for perps (the instrument you are trading):
Open Interest: Latest: 28751.48  Average: 28759.11
Funding Rate: 1.25e-05
Intraday series (by minute, oldest → latest):
Mid prices: [111727.5, 111738.0, 111796.0, 111715.0, 111791.0, 111731.5, 111582.5, 111604.5, 111576.5, 111646.5]
EMA indicators (20‑period): [111730.758, 111731.067, 111736.87, 111734.311, 111739.71, 111739.166, 111723.722, 111712.605, 111700.738, 111691.716]
MACD indicators: [27.048, 24.903, 27.567, 22.798, 25.263, 22.36, 7.306, -2.178, -11.1, -16.527]
RSI indicators (7‑Period): [44.919, 48.778, 58.211, 44.648, 56.365, 48.02, 32.539, 37.062, 35.313, 38.52]
RSI indicators (14‑Period): [50.2, 52.047, 56.812, 49.347, 55.559, 50.834, 40.594, 42.959, 41.823, 43.351]
Longer‑term context (4‑hour timeframe):
20‑Period EMA: 110141.305 vs. 50‑Period EMA: 110073.134
3‑Period ATR: 405.026 vs. 14‑Period ATR: 834.009
Current Volume: 6.609 vs. Average Volume: 4890.232
MACD indicators: [24.991, 98.703, 183.649, 296.291, 396.643, 385.949, 413.696, 463.826, 498.613, 557.919]
RSI indicators (14‑Period): [55.277, 54.713, 56.349, 59.06, 59.921, 53.307, 55.817, 57.812, 57.861, 60.232]

ALL ETH DATA
current_price = 3945.75, current_ema20 = 3946.632, current_macd = 1.073, current_rsi (7 period) = 42.649
In addition, here is the latest ETH open interest and funding rate for perps:
Open Interest: Latest: 478992.05  Average: 479226.84
Funding Rate: 1.25e-05
Intraday series (3‑minute intervals, oldest → latest):
Mid prices: [3946.65, 3949.95, 3952.15, 3950.2, 3950.05, 3948.75, 3942.8, 3944.85, 3943.0, 3945.75]
EMA indicators (20‑period): [3946.988, 3947.304, 3947.761, 3947.974, 3947.995, 3948.072, 3947.465, 3947.221, 3946.857, 3946.632]
MACD indicators: [4.328, 4.125, 4.063, 3.8, 3.407, 3.108, 2.272, 1.847, 1.373, 1.073]
RSI indicators (7‑Period): [41.245, 53.225, 57.461, 51.156, 46.097, 48.093, 31.824, 42.119, 38.906, 42.649]
RSI indicators (14‑Period): [51.744, 57.399, 59.536, 56.006, 53.099, 53.957, 43.757, 48.484, 46.511, 48.176]
Longer‑term context (4‑hour timeframe):
20‑Period EMA: 3904.208 vs. 50‑Period EMA: 3928.133
3‑Period ATR: 17.945 vs. 14‑Period ATR: 42.181
Current Volume: 252.632 vs. Average Volume: 108039.568
MACD indicators: [-25.611, -24.279, -20.255, -12.325, -5.843, -5.501, -2.194, 1.084, 2.594, 4.275]
RSI indicators (14‑Period): [45.792, 46.243, 50.221, 56.104, 56.26, 49.168, 53.112, 53.968, 52.344, 53.11]

ALL SOL DATA
current_price = 192.655, current_ema20 = 193.452, current_macd = -0.455, current_rsi (7 period) = 14.652
In addition, here is the latest SOL open interest and funding rate for perps:
Open Interest: Latest: 3376220.8  Average: 3377587.02
Funding Rate: 1.25e-05
Intraday series (3‑minute intervals, oldest → latest):
SOL mid prices: [193.375, 193.495, 193.615, 193.47, 193.415, 193.27, 192.52, 192.67, 192.525, 192.655]
EMA indicators (20‑period): [194.189, 194.123, 194.076, 194.019, 193.95, 193.885, 193.763, 193.657, 193.551, 193.452]
MACD indicators: [-0.161, -0.194, -0.208, -0.229, -0.256, -0.277, -0.344, -0.388, -0.427, -0.455]
RSI indicators (7‑Period): [9.058, 24.796, 33.52, 28.734, 24.413, 23.68, 13.285, 16.477, 15.054, 14.652]
RSI indicators (14‑Period): [26.076, 33.531, 37.914, 34.867, 31.93, 31.427, 22.791, 24.46, 23.268, 22.94]
Longer‑term context (4‑hour timeframe):
20‑Period EMA: 190.275 vs. 50‑Period EMA: 190.303
3‑Period ATR: 0.896 vs. 14‑Period ATR: 2.401
Current Volume: 380.84 vs. Average Volume: 855137.596
MACD indicators: [-0.21, 0.142, 0.409, 0.682, 0.928, 0.866, 1.088, 1.283, 1.427, 1.551]
RSI indicators (14‑Period): [56.674, 56.915, 56.702, 58.153, 58.996, 51.978, 58.148, 58.83, 58.967, 59.583]

ALL BNB DATA
current_price = 1113.75, current_ema20 = 1113.878, current_macd = -0.53, current_rsi (7 period) = 43.601
In addition, here is the latest BNB open interest and funding rate for perps:
Open Interest: Latest: 70998.17  Average: 71025.92
Funding Rate: -1.43308e-05
Intraday series (3‑minute intervals, oldest → latest):
BNB mid prices: [1113.45, 1114.05, 1114.7, 1114.1, 1113.7, 1113.8, 1111.9, 1112.45, 1111.85, 1113.75]
EMA indicators (20‑period): [1115.031, 1114.933, 1114.911, 1114.834, 1114.707, 1114.63, 1114.379, 1114.2, 1113.981, 1113.878]
MACD indicators: [0.214, 0.119, 0.1, 0.035, -0.064, -0.109, -0.294, -0.396, -0.519, -0.53]
RSI indicators (7‑Period): [30.139, 39.781, 48.133, 42.271, 37.011, 42.569, 28.59, 35.13, 31.138, 43.601]
RSI indicators (14‑Period): [41.671, 46.329, 50.58, 47.134, 43.912, 46.536, 37.551, 40.791, 38.228, 44.488]
Longer‑term context (4‑hour timeframe):
20‑Period EMA: 1107.308 vs. 50‑Period EMA: 1113.8
3‑Period ATR: 7.066 vs. 14‑Period ATR: 14.959
Current Volume: 1.202 vs. Average Volume: 8942.843
MACD indicators: [-0.423, 1.994, 4.56, 5.616, 6.587, 5.462, 4.964, 4.391, 4.617, 4.407]
RSI indicators (14‑Period): [55.151, 57.426, 59.377, 55.801, 56.451, 49.594, 51.17, 50.682, 53.401, 51.977]

ALL XRP DATA
current_price = 2.54045, current_ema20 = 2.541, current_macd = -0.001, current_rsi (7 period) = 53.42
In addition, here is the latest XRP open interest and funding rate for perps:
Open Interest: Latest: 45958086.0  Average: 45917655.8
Funding Rate: 1.25e-05
Intraday series (3‑minute intervals, oldest → latest):
XRP mid prices: [2.539, 2.541, 2.544, 2.543, 2.543, 2.543, 2.539, 2.539, 2.537, 2.54045]
EMA indicators (20‑period): [2.542, 2.542, 2.542, 2.542, 2.542, 2.542, 2.542, 2.542, 2.541, 2.541]
MACD indicators: [-0.001, -0.001, -0.001, -0.001, -0.001, -0.001, -0.001, -0.001, -0.001, -0.001]
RSI indicators (7‑Period): [28.344, 43.913, 61.148, 51.629, 49.626, 53.807, 37.163, 37.163, 31.139, 53.42]
RSI indicators (14‑Period): [39.799, 46.386, 55.551, 50.746, 49.717, 51.821, 42.883, 42.883, 39.273, 50.6]
Longer‑term context (4‑hour timeframe):
20‑Period EMA: 2.455 vs. 50‑Period EMA: 2.447
3‑Period ATR: 0.015 vs. 14‑Period ATR: 0.028
Current Volume: 9526.0 vs. Average Volume: 8601095.308
MACD indicators: [-0.007, -0.007, -0.006, -0.003, 0.001, 0.007, 0.012, 0.017, 0.023, 0.028]
RSI indicators (14‑Period): [48.816, 47.171, 49.198, 55.14, 57.799, 61.27, 63.458, 64.605, 68.444, 68.37]

ALL DOGE DATA
current_price = 0.197665, current_ema20 = 0.198, current_macd = -0.0, current_rsi (7 period) = 35.9
In addition, here is the latest DOGE open interest and funding rate for perps:
Open Interest: Latest: 588092370.0  Average: 588074042.8
Funding Rate: 4.036e-07
Intraday series (3‑minute intervals, oldest → latest):
DOGE mid prices: [0.198, 0.198, 0.198, 0.198, 0.198, 0.198, 0.198, 0.198, 0.198, 0.197665]
EMA indicators (20‑period): [0.198, 0.198, 0.198, 0.198, 0.198, 0.198, 0.198, 0.198, 0.198, 0.198]
MACD indicators: [-0.0, -0.0, -0.0, -0.0, -0.0, -0.0, -0.0, -0.0, -0.0, -0.0]
RSI indicators (7‑Period): [23.406, 46.855, 60.117, 44.695, 37.652, 41.421, 30.852, 34.303, 31.269, 35.9]
RSI indicators (14‑Period): [37.536, 48.563, 56.298, 47.233, 42.614, 44.654, 37.652, 39.456, 37.508, 39.751]
Longer‑term context (4‑hour timeframe):
20‑Period EMA: 0.196 vs. 50‑Period EMA: 0.197
3‑Period ATR: 0.001 vs. 14‑Period ATR: 0.002
Current Volume: 272965.0 vs. Average Volume: 83085047.767
MACD indicators: [-0.0, -0.0, -0.0, 0.0, 0.0, 0.0, 0.0, 0.001, 0.001, 0.001]
RSI indicators (14‑Period): [52.918, 51.453, 52.088, 54.812, 56.316, 50.468, 54.058, 56.012, 56.355, 56.57]

HERE IS YOUR ACCOUNT INFORMATION & PERFORMANCE
Current Total Return (percent): 74.98%
Available Cash: 97.8
Current Account Value: 17498.3
Current live positions & performance:
{'symbol': 'BTC', 'quantity': 1.96, 'entry_price': 107993.0, 'current_price': 111646.5, 'liquidation_price': 104025.51, 'unrealized_pnl': 7160.86, 'leverage': 20, 'exit_plan': {'invalidation_condition': '4-hour close below 105000', 'profit_target': 112253.96, 'stop_loss': 105877.7}, 'confidence': 0.88, 'risk_usd': 403.75, 'sl_oid': 208968581802, 'tp_oid': 208968572628, 'wait_for_fill': False, 'entry_oid': 208968549342, 'notional_usd': 218827.14}
Sharpe Ratio: 0.294
Alpha Arena 比赛中提供给AI模型的数据和指标可以总结为以下三大类,它们共同构成了一个非常专业和完整的量化决策环境。
数据与指标
| 数据类别 | 具体指标 |
|---|---|
| 时间与上下文 | 比赛已进行时间、模型被调用次数、当前时间 |
| 市场数据(按币种) | 即时数据:最新价格、EMA(20)、MACD、RSI(7) 日内序列(3分钟间隔):中间价、EMA(20)、MACD、RSI(7/14)的历史序列 长期上下文(4小时级别):EMA(20 vs 50)、ATR(3 vs 14)、当前成交量与平均成交量、MACD和RSI(14)历史序列 衍生品数据:未平仓合约、资金费率 |
| 账户与绩效 | 总收益率、账户总价值、可用现金、当前持仓详情(数量、入场价、强平价、未实现盈亏、杠杆等)、夏普比率 |
这份提示词构建了一个高度仿真的量化交易场景。它要求AI模型不仅要能解读复杂的市场信号,更要能将分析转化为具体的交易指令,平均每分钟会调用大模型,获取如何交易的指令。
普通人可以怎么用
虽然我们无法完全复刻Alpha Arena的实验环境,但可以借鉴其思路,将AI作为提升个人投资能力的助手。
-
作为信息整合助手
你可以利用AI强大的自然语言处理能力,让它帮你快速完成基础研究工作。例如,你可以要求AI:“总结一下当前比特币现货ETF的资金流入流出情况及其对价格的影响”或“对比特币下一次减半事件的潜在市场影响做一个分析”。AI可以快速梳理海量新闻、研报和社交媒体情绪,为你提供一份结构清晰的摘要,帮你节省大量信息搜集的时间。 -
用于策略决策
模仿上文的提示词,每分钟调用模型的api接口,通过Python获取加密货币的即时数据、日内序列和长期上下文数据,一个高效的方法是使用专业的库(如ccxt)来连接交易所的API。或者使用 AkShare 来获取实时和日线数据(无需注册,数据源丰富),并使用 Baostock 来获取更精细的分钟级K线数据(对A股分钟级历史数据支持完善),或者借助 QMT等量化平台的行情数据获取能力。
在拥抱AI的同时,也必须清醒地认识到它的当前局限,避免过度神话和依赖。交易策略有效的前提是独特性,如果大量投资者使用同一AI模型,会导致买卖点位高度集中,形成同买同卖的局面,最终使策略失效。大家觉得后续哪个模型会赢?


 9735
9735

 被折叠的 条评论
为什么被折叠?
被折叠的 条评论
为什么被折叠?
 到【灌水乐园】发言


