


matplotlib包是目前绘制2D图像最常用的python包,是一个数学绘图库,我们将使用它来制作简单的图表,如折线图和散点图等。数据可视化指的是通过可视化表示来探索数据。接下来开始学习简单的绘图知识。
使用matplotlib绘制一个简单的折线图,再对其进行定制,以实现信息更丰富的数据可视化。
import matplotlib.pyplot as plt
squares=[1,4,9,16,25,36]
plt.plot(squares)
plt.show()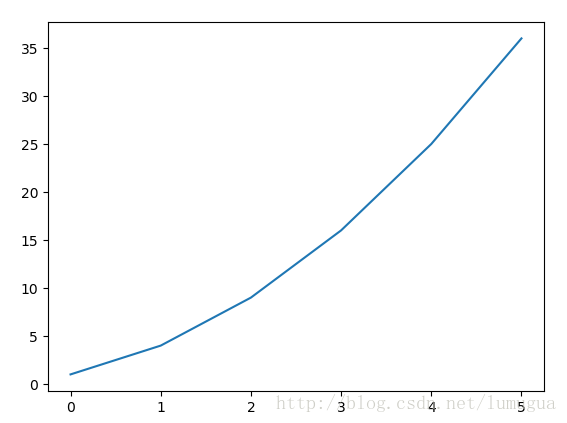
修改标签文字和线条粗细
import matplotlib.pyplot as plt
squares=[1,4,9,16,25]
#绘制的线条的粗细
plt.plot(squares, linewidth=5)
#设置图表标题,并给坐标抽加上标签,参数fontsize 指定图表中文字的大小
plt.title("Square Numbers", fontsize=24)
plt.xlabel("Value", fontsize=14)
plt.ylabel("Square of value", fontsize=14)
#设置刻度标记的大小,both影响x轴和y轴上的刻度
最低0.47元/天 解锁文章


 2058
2058


 被折叠的 条评论
为什么被折叠?
被折叠的 条评论
为什么被折叠?
 到【灌水乐园】发言


