


贷款数据的预测分析,通过使用python来分析申请人哪些条件对贷款有影响,并预测哪些客户更容易获得银行贷款。
数据来源 Loan Prediction:https://datahack.analyticsvidhya.com/contest/practice-problem-loan-prediction-iii/
提出问题:哪些客户更容易获得银行贷款?
导入数据
import numpy as np
import pandas as pd
from matplotlib import pyplot as plt
import seaborn as sns
%matplotlib inline

# 导入数据
full_data = pd.read_csv('loan_train.csv')
full_data.shape
(614, 13)
数据有614行,13列。
查看前五行数据
full_data.head()
| Loan_ID | Gender | Married | Dependents | Education | Self_Employed | ApplicantIncome | CoapplicantIncome | LoanAmount | Loan_Amount_Term | Credit_History | Property_Area | Loan_Status | |
|---|---|---|---|---|---|---|---|---|---|---|---|---|---|
| 0 | LP001002 | Male | No | 0 | Graduate | No | 5849 | 0.0 | NaN | 360.0 | 1.0 | Urban | Y |
| 1 | LP001003 | Male | Yes | 1 | Graduate | No | 4583 | 1508.0 | 128.0 | 360.0 | 1.0 | Rural | N |
| 2 | LP001005 | Male | Yes | 0 | Graduate | Yes | 3000 | 0.0 | 66.0 | 360.0 | 1.0 | Urban | Y |
| 3 | LP001006 | Male | Yes | 0 | Not Graduate | No | 2583 | 2358.0 | 120.0 | 360.0 | 1.0 | Urban | Y |
| 4 | LP001008 | Male | No | 0 | Graduate | No | 6000 | 0.0 | 141.0 | 360.0 | 1.0 | Urban | Y |
一、理解数据
Loan_ID 贷款人ID
Gender 性别 (Male, female)
ApplicantIncome 申请人收入
Coapplicant Income 申请收入
Credit_History 信用记录
Dependents 亲属人数
Education 教育程度
LoanAmount 贷款额度
Loan_Amount_Term 贷款时间长
Loan_Status 贷款状态 (Y, N)
Married 婚姻状况(NO,Yes)
Property_Area 所在区域包括:城市地区、半城区和农村地区
Self_Employed 职业状况:自雇还是非自雇
查看描述统计数据
full_data.describe()
| ApplicantIncome | CoapplicantIncome | LoanAmount | Loan_Amount_Term | Credit_History | |
|---|---|---|---|---|---|
| count | 614.000000 | 614.000000 | 592.000000 | 600.00000 | 564.000000 |
| mean | 5403.459283 | 1621.245798 | 146.412162 | 342.00000 | 0.842199 |
| std | 6109.041673 | 2926.248369 | 85.587325 | 65.12041 | 0.364878 |
| min | 150.000000 | 0.000000 | 9.000000 | 12.00000 | 0.000000 |
| 25% | 2877.500000 | 0.000000 | 100.000000 | 360.00000 | 1.000000 |
| 50% | 3812.500000 | 1188.500000 | 128.000000 | 360.00000 | 1.000000 |
| 75% | 5795.000000 | 2297.250000 | 168.000000 | 360.00000 | 1.000000 |
| max | 81000.000000 | 41667.000000 | 700.000000 | 480.00000 | 1.000000 |
查看数据集
full_data.info()
<class 'pandas.core.frame.DataFrame'>
RangeIndex: 614 entries, 0 to 613
Data columns (total 13 columns):
Loan_ID              614 non-null object
Gender               601 non-null object
Married              611 non-null object
Dependents           599 non-null object
Education            614 non-null object
Self_Employed        582 non-null object
ApplicantIncome      614 non-null int64
CoapplicantIncome    614 non-null float64
LoanAmount           592 non-null float64
Loan_Amount_Term     600 non-null float64
Credit_History       564 non-null float64
Property_Area        614 non-null object
Loan_Status          614 non-null object
dtypes: float64(4), int64(1), object(8)
memory usage: 62.4+ KB
看到数据有缺失值,需要后面进一步处理
二、从单变量进行分析
1. 分析目标变量Loan_Status贷款状态
#目标变量统计
full_data['Loan_Status'].value_counts()
Y    422
N    192
Name: Loan_Status, dtype: int64
#统计百分比
full_data['Loan_Status'].value_counts(normalize=True)
Y    0.687296
N    0.312704
Name: Loan_Status, dtype: float64
sns.countplot(x='Loan_Status', data=full_data, palette = 'Set1')

614个人中有422人(约69%)获得贷款批准
2.Gender 性别特征
full_data['Gender'].value_counts(normalize=True)
Male      0.813644
Female    0.186356
Name: Gender, dtype: float64
sns.countplot(x='Gender', data=full_data, palette = 'Set1')
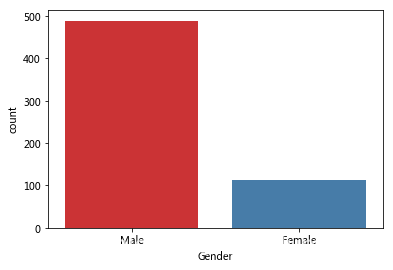
数据集中80%的申请人是男性。
3.Married婚姻特征
full_data['Married'].value_counts(normalize=True).plot.bar(title= 'Married')
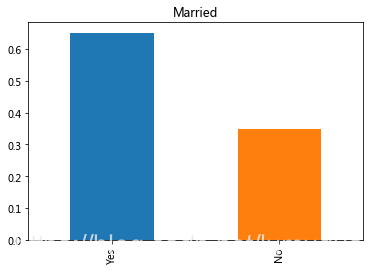
有65%的申请贷款的人是已经结婚。
4.Dependent亲属特征
Dependents=full_data['Dependents'].value_counts(normalize=True)
Dependents
0     0.575960
1     0.170284
2     0.168614
3+    0.085142
Name: Dependents, dtype: float64
Dependents.plot.bar(tit 最低0.47元/天 解锁文章


 1万+
1万+


 被折叠的 条评论
为什么被折叠?
被折叠的 条评论
为什么被折叠?
 到【灌水乐园】发言


