


1、方案选择
- kube-prometheus,全家桶。
- 分别安装prometheus和grafana
我也不想选择第二种,但是我就一台普通的PC,安装kube-prometheus直接给我报错CPU不够用了,我~~
2、先尝试第一种,如果成功了就别瞎折腾了,心累~
先看下对应关系,最新的直接在github上看,旧的可能不好找。
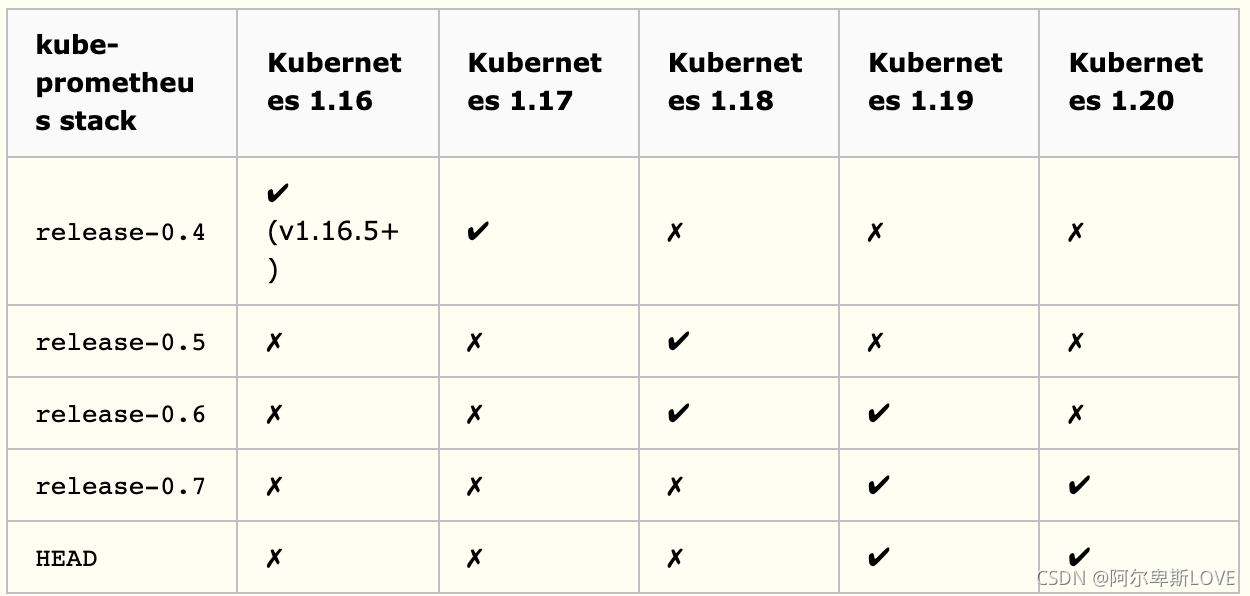
git clone https://github.com/prometheus-operator/kube-prometheus.git
git checkout release-0.6 # 上面的兼容性说明
kubectl create -f manifests/setup
kubectl create -f manifests #完成安装
kubectl --namespace monitoring port-forward svc/prometheus-k8s 9090  ## Prometheus
kubectl --namespace monitoring port-forward svc/grafana 3000  ## Grafana
http://localhost:9090
http://localhost:3000
执行上面的命令,完成了就到这吧
3、安装prometheus
# 添加prometheus helm仓库
helm repo add prometheus-community https://prometheus-community.github.io/helm-charts
# 在monitoring下面安装prometheus
kubectl create ns monitoring
helm install prometheus prometheus-community/prometheus -n monitoring
# 暴露服务
kubectl expose service prometheus-server --type=NodePort --target-port=9090 --name=prometheus-server-np -n monitoring
# 访问服务
-> % minikube service prometheus-server-np -n monitoring

|</
最低0.47元/天 解锁文章


 1万+
1万+


 被折叠的 条评论
为什么被折叠?
被折叠的 条评论
为什么被折叠?
 到【灌水乐园】发言


