


系列文章目录
提示:本文是本系列教程的第6篇,前期工作请参考以下5篇 :
使用TicToc学习OMNeT++——第 0 部分 - 简介
使用TicToc学习OMNeT++——第 1 部分 - 入门
使用TicToc学习OMNeT++——第 2 部分 - 运行仿真
使用TicToc学习OMNeT++——第 3 部分 - 增强 2 节点 TicToc
使用 TicToc 学习 OMNeT++——第 4 部分 - 将其变成真正的网络
提示:本人的第6篇文章,写得不好,请读者多多包涵
前言
提示:这里说明了本文要记录的大概内容:
本文基于原版英文教程的第5部分:Part 5 - Adding Statistics Collection进行翻译和论述,并结合仿真手册,用户指南和AI问答以厘清基本概念。以及对应于原教程中布置的练习(如果有的话),由本人完成的的作业。
提示:以下是本篇文章正文内容
一、原文翻译
原文经过本人的人工润色,主要对一些复杂嵌套的英文语句调整语序,修改一些术语翻译错误,然后是修正句内的修饰关系。此外,原文翻译中还会补充一些自己实操过程中的截图。
Part 5 - Adding Statistics Collection 第 5 部分 - 添加统计信息集合
5.1 Displaying the number of packets sent/received 5.1 显示发送/接收的数据包数量
To get an overview at runtime how many messages each node sent or received, we’ve added two counters to the module class: numSent and numReceived.
为了在运行时概览每个节点发送或接收的消息数,我们向模块类中添加了两个计数器:numSent 和 numReceived。
class Txc14 : public cSimpleModule
{
  private:
    long numSent;
    long numReceived;

  protected:
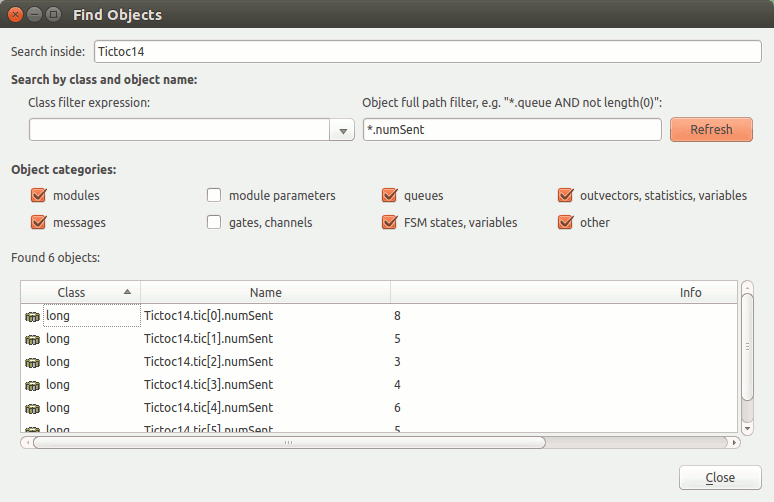
They are set to zero and WATCH’ed in the initialize() method. Now we can use the Find/inspect objects dialog (Inspect menu; it is also on the toolbar) to learn how many packets were sent or received by the various nodes.
它们在 initialize() 方法中设置为零并被 WATCH。现在,我们可以使用“查找/检查对象”对话框(“检查”菜单;它也在工具栏上)来了解各个节点发送或接收的数据包数量。
提示:在Qtenv界面中,快捷键:Ctrl+S
It’s true that in this concrete simulation model the numbers will be roughly the same, so you can only learn from them that intuniform() works properly. But in real-life simulations it can be very useful that you can quickly get an overview about the state of various nodes in the model.
确实,在这个具体的模拟模型中,数字大致相同,因此您只能从中学习正常 intuniform() 工作的内容。但在现实生活中的仿真中,您可以快速了解模型中各个节点的状态,这非常有用。
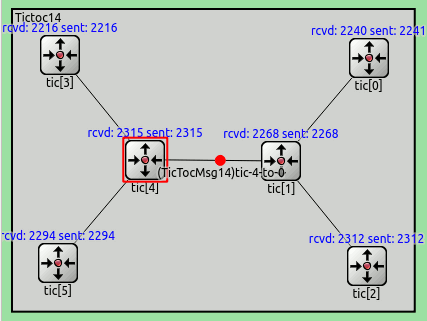
It can be also arranged that this info appears above the module icons. The t= display string tag specifies the text; we only need to modify the displays string during runtime. The following code does the job:
也可以安排此信息显示在模块图标上方。 t= 显示字符标签 指定文本;我们只需要在运行时修改显示字符串。以下代码可以完成这项工作:
void Txc14::refreshDisplay() const
{
    char buf[40];
    sprintf(buf, "rcvd: %ld sent: %ld", numReceived, numSent);
    getDisplayString().setTagArg("t", 0, buf);
}
And the result looks like this:
结果如下所示:
Sources: tictoc14.ned, txc14.cc, omnetpp.ini
源(代码):tictoc14.ned, txc14.cc, omnetpp.ini
5.2 Adding statistics collection 5.2 添加统计信息收集
The previous simulation model does something interesting enough so that we can collect some statistics. For example, you may be interested in the average hop count a message has to travel before reaching its destination.
前面的仿真模型做了一些足够有趣的事情,以便我们可以收集一些统计数据。例如,您可能对消息在到达目的地之前必须经过的平均跃点计数感兴趣。
We’ll record in the hop count of every message upon arrival into an output vector (a sequence of (time,value) pairs, sort of a time series). We also calculate mean, standard deviation, minimum, maximum values per node, and write them into a file at the end of the simulation. Then we’ll use tools from the OMNeT++ IDE to analyse the output files.
我们将在到达时 记录 每条消息的跳数 到 输出向量((时间,值)对的序列,类似于时间序列)中。我们还计算每个节点的平均值、标准差、最小值、最大值,并在仿真结束时将它们写入文件中。然后,我们将使用 OMNeT++ IDE 中的工具来分析输出文件。
For that, we add an output vector object (which will record the data into Tictoc15-#0.vec) and a histogram object (which also calculates mean, etc) to the class.
为此,我们将一个输出向量对象(它将数据记录到 Tictoc15-#0.vec )和一个直方图对象(它也计算均值等)添加到类中。
class Txc15 : public cSimpleModule
{
  private:
    long numSent;
    long numReceived;
    cHistogram hopCountStats; // 跳数统计 原来的cLongHistogram类 已经被归结进 cHistogram类了
    cOutVector hopCountVector; // 跳数向量

  protected:
When a message arrives at the destination node, we update the statistics. The following code has been added to handleMessage():
当消息到达目标节点时,我们会更新统计信息。以下代码已添加到 handleMessage() :
        hopCountVector.record(hopCount);
        hopCountStats.collect(hopCount);
The hopCountVector.record() call writes the data into Tictoc15-#0.vec. With a large simulation model or long execution time, the Tictoc15-#0.vec file may grow very large. To handle this situation, you can specifically disable/enable vector in omnetpp.ini, and you can also specify a simulation time interval in which you’re interested (data recorded outside this interval will be discarded.)
hopCountVector.record() 调用将数据写入 Tictoc15-#0.vec 。对于大型仿真模型或较长的执行时间, Tictoc15-#0.vec 文件可能会变得非常大。为了处理这种情况,您可以在omnetpp.ini中专门禁用/启用矢量,还可以指定您感兴趣的仿真时间间隔(在此间隔之外记录的数据将被丢弃。
When you begin a new simulation, the existing Tictoc15-#0.vec/sca files get deleted.
当您开始新的模拟时,现有 Tictoc15-#0.vec/sca 文件将被删除。
Scalar data (collected by the histogram object in this simulation) have to be recorded manually, in the finish() function. finish() is invoked on successful completion of the simulation, i.e. not when it’s stopped with an error. The recordScalar() calls in the code below write into the Tictoc15-#0.sca file.
标量数据(在此仿真中由直方图对象收集)必须在 finish() 函数中手动记录。 finish() 在成功完成模拟时调用,即不在因错误而停止时调用。以下代码中的 recordScalar() 调用将写入 Tictoc15-#0.sca 文件。
void Txc15::finish() // finish函数要先stop再通过conclude simulation按钮调用
{
    // This function is called by OMNeT++ at the end of the simulation. 该函数在模拟结束时由OMNeT++调用。
    EV << "Sent:    " << numSent << endl;
    EV << "Received:    " << numReceived <<endl;
    EV << "Hop count, min:  " << hopCountStats.getMin() << endl;
    EV << "Hop count, max:  " << hopCountStats.getMax() << endl;
    EV << "Hop count, mean:  " << hopCountStats.getMean() << endl;
    EV << "Hop count, stddev:  " << hopCountStats.getStddev() << endl;

    recordScalar("#sent", numSent);
    recordScalar("#received", numReceived);

    hopCountStats.recordAs("hop count");
}
The files are stored in the results/ subdirectory.
文件存储在 results/ 子目录中。
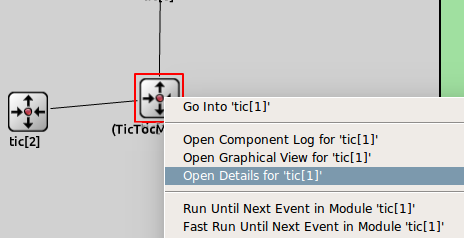
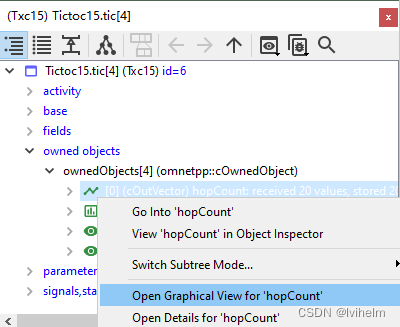
You can also view the data during simulation. To do that, right click on a module, and choose Open Details. In the module inspector’s Contents page you’ll find the hopCountStats and hopCountVector objects. To open their inspectors, right click on cHistogram hopCountStats or cOutVector HopCount, and click Open Graphical View.
您还可以在仿真期间查看数据。为此,请右键单击模块,然后选择“Open Details/打开详细信息”。在模块检查器的“Contents/内容”页面中, 您将找到 hopCountStats 和 hopCountVector 对象。要打开其检查器,请右键单击 cHistogram hopCountStats 或 cOutVector HopCount ,然后单击 Open Graphical View 。
The inspector: 检查器
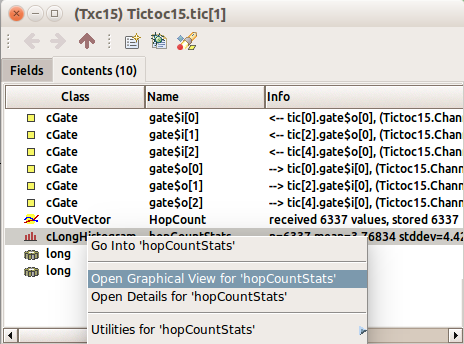
提示:这是本人操作的截图
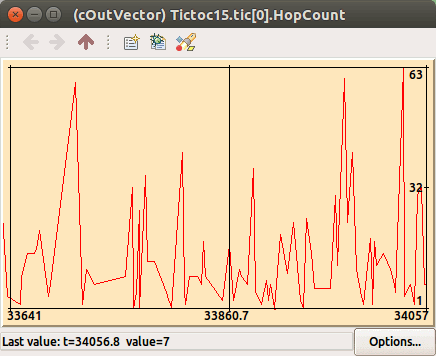
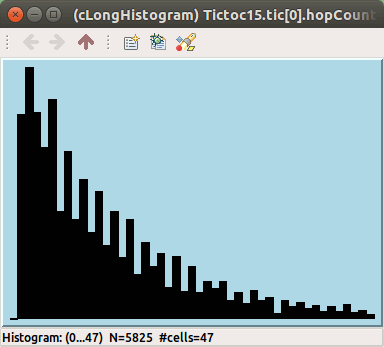
They will be initially empty – run the simulation in Fast (or even Express) mode to get enough data to be displayed. After a while you’ll get something like this:
它们最初将是空的 - 在快速(甚至极速)模式下运行模拟以获得足够的数据来显示。过了一会儿,你会得到这样的东西:
When you think enough data has been collected, you can stop the simulation and then we’ll analyse the result files (Tictoc15-#0.vec and Tictoc15-#0.sca) off-line. You’ll need to choose Simulate -> Call finish() from the menu (or click the corresponding toolbar button) before exiting – this will cause the finish() functions to run and data to be written into Tictoc15-#0.sca.
当您认为已经收集了足够的数据时,您可以停止仿真,然后我们将离线分析结果文件( Tictoc15-#0.vec 和 Tictoc15-#0.sca )。在退出之前,您需要从菜单中选择 Simulate -> Call finish() (或单击相应的工具栏按钮) – 这将导致 finish() 函数运行并将数据写入 Tictoc15-#0.sca 。
Sources: tictoc15.ned, txc15.cc, omnetpp.ini
源(代码):tictoc15.ned, txc15.cc, omnetpp.ini
5.3 Statistic collection without modifying your mode 5.3 在不修改模型的情况下收集统计数据
In the previous step we have added statistic collection to our model. While we can compute and save any value we wish, usually it is not known at the time of writing the model, what data the enduser will need.
在前面的步骤中,我们已经将统计数据收集添加到模型中。虽然我们可以计算和保存任何我们想要的值,但通常 在编写模型时 并不知道 最终用户需要什么数据。
OMNeT++ provides an additional mechanism to record values and events. Any model can emit signals that can carry a value or an object. The model writer just have to decide what signals to emit, what data to attach to them and when to emit them. The enduser can attach ‘listeners’ to these signals that can process or record these data items. This way the model code does not have to contain any code that is specific to the statistics collection and the enduser can freely add additional statistics without even looking into the C++ code.
OMNeT++提供了一种额外的机制来记录值和事件。任何模型都可以发出可以携带值或对象的信号。模型编写者只需要决定发出什么信号,附加什么数据以及何时发出。最终用户可以将“侦听器”附加到这些信号上,以处理或记录这些数据项。这样,模型代码 就不必包含 任何 特定于统计信息收集的 代码,最终用户可以自由地添加额外的统计信息,甚至不需要查看C++代码。
We will re-write the statistic collection introduced in the last step to use signals. First of all, we can safely remove all statistic related variables from our module. There is no need for the cOutVector and cHistogram classes either. We will need only a single signal that carries the hopCount of the message at the time of message arrival at the destination.
我们将重写上一步中引入的统计数据收集,以使用信号。首先,我们可以安全地从我们的模块中删除所有与统计相关的变量。也不需要 cOutVector 和 cHistogram 类。我们只需要一个信号,在消息到达目的地时 携带消息的 hopCount。
First we need to define our signal. The arrivalSignal is just an identifier that can be used later to easily refer to our signal.
首先,我们需要定义我们的信号。 arrivalSignal 只是一个标识符,稍后可以用来轻松引用我们的信号。
class Txc16 : public cSimpleModule
{
  private:
    simsignal_t arrivalSignal;

  protected:
We must register all signals before using them. The best place to do this is the initialize() method of the module.
我们必须先注册所有信号 再使用它们。做这件事 最好的地方 是模块的 initialize() 方法。
void Txc16::initialize() // 定义初始化行为
{
    // Initialize variables 初始化变量
    arrivalSignal = registerSignal("arrival");
    // Module 0 sends the first message 模块0 发送第一条消息
    if(getIndex() == 0){
Now we can emit our signal, when the message has arrived to the destination node.
现在我们可以在消息到达目的节点时发出信号。
void Txc16::handleMessage(cMessage *msg)// 定义收到消息后的消息处理行为
{
    // 类型转换
    TictocMsg16 *ttmsg = check_and_cast<TictocMsg16 *>(msg);
    // 若消息到达目的地
    if(ttmsg->getDestination() == getIndex()){
        // Message arrived. 消息到达
        int hopCount = ttmsg->getHopCount();

        // send a signal 发送信号 注意!信号携带了数据 hopCount
        emit(arrivalSignal, hopCount);

        EV << "Message " << ttmsg << "arrived after "<<ttmsg->getHopCount() <<" hops.\n";
As we do not have to save or store anything manually, the finish() method can be deleted. We no longer need it.
由于我们不必手动保存或存储任何内容,因此可以删除 finish() 方法。我们不再需要它了。
The last step is that we have to define the emitted signal also in the NED file. Declaring signals in the NED file allows you to have all information about your module in one place. You will see the parameters it takes, its input and output gates, and also the signals and statistics it provides.
最后一步是我们必须在NED文件中定义发射信号。在NED文件中声明信号允许您在一个地方拥有关于模块的所有信息。您将看到它采用的参数、输入和输出门,以及它提供的信号和统计数据。
simple Txc16
{
    parameters:
        @signal[arrival](type="long");
        @statistic[hopCount](title="hop count"; source="arrival"; record=vector, stats; interpolationmode=none;);

        @display("i=block/routing"); //i 应该是指 icon/图标
Now we can define also a statistic that should be collected by default. Our previous example has collected statistics (max, min, mean, count, etc.) about the hop count of the arriving messages, so let’s collect the same data here, too.
现在我们还可以定义默认情况下应该收集的统计信息。我们前面的示例已收集统计信息(最大值、最小值、平均值、计数等)关于到达消息的跳数,所以让我们在这里也收集相同的数据。
The source key specifies the signal we want our statistic to attach to. The record key can be used to tell what should be done with the received data. In our case we specify that each value must be saved in a vector file (vector) and also we need to calculate min,max,mean,count etc. (stats). (NOTE: stats is just a shorthand for min, max, mean, sum, count, etc.) With this step we have finished our model.
source 键指定我们希望统计数据附加到的信号。 record 键可以用来告诉应该对接收到的数据做什么。在我们的例子中,我们指定每个值必须保存在一个向量文件(vector)中,并且我们还需要计算min,max,mean,count等(stats)。(NOTE: stats 只是min、max、mean、sum、count等的简写。)通过这一步,我们完成了模型。
Now we have just realized that we would like to see a histogram of the stats on the tic[1] module. On the other hand we are short on disk storage and we are not interested having the vector data for the first three module tic 0,1,2. No problem. We can add our histogram and remove the unneeded vector recording without even touching the C++ or NED files. Just open the INI file and modify the statistic recording:
现在我们刚刚意识到,我们希望看到 tic[1] 模块上的 stats 直方图。另一方面,我们缺少磁盘存储,我们对前三个模块 tic 0,1,2的矢量数据不感兴趣。没问题。我们可以添加直方图并删除不需要的矢量记录,甚至不需要接触C++或NED文件。只需打开INI文件并修改统计记录:
[Config Tictoc16]
network = Tictoc16
**.tic[1].hopcount.result-recording-modes = +histogram
**.tic[0..2].hopcount.result-recording-modes = -vector
We can configure a wide range of statistics without even looking into the C++ code, provided that the original model emits the necessary signals for us.
我们可以配置各种各样的统计数据,甚至不需要查看C++代码,只要原始模型为我们发出必要的信号。
Sources: tictoc16.ned, txc16.cc, omnetpp.ini
源(代码):tictoc16.ned, txc16.cc, omnetpp.ini
5.4 Adding figures 5.4 添加图形
OMNeT++ can display figures on the canvas, such as text, geometric shapes or images. These figures can be static, or change dynamically according to what happens in the simulation. In this case, we will display a static descriptive text, and a dynamic text showing the hop count of the last message that arrived at its destination.
OMNeT++可以在画布上显示图形,如文本、几何形状或图像。这些图形可以是静态的,或根据模拟中发生的情况动态变化。在本例中,我们将展示一个静态描述性文本,以及一个动态文本,显示到达目的地的最后一条消息的跳数。
We create figures in tictoc17.ned, with the @figure property.
我们在tictoc17.ned中使用 @figure 属性创建图形。
network Tictoc17
{
    parameters:
        @figure[description](type=text; pos=5,20; font=,,bold;text="random routing example - displaying last hop count"); // 随机路由示例 - 显示最后的跳数
        @figure[lasthopcount](type=text; pos=5,35; text="last hop count: N/A"); // 最后的跳数:N/A(not a number?)
This creates two text figures named description and lasthopcount, and sets their positions on the canvas (we place them in the top right corner). The font attribute sets the figure text’s font. It has three parameters: typeface, size, style. Any one of them can be omitted to leave the parameter at default. Here we set the description figure’s font to bold.
这将创建两个名为 description 和 lasthopcount 的文本图形,并设置它们在画布上的位置(我们将它们放置在右上角)。 font 属性设置图形文本的字体。它有三个参数: typeface, size, style 。可以省略其中任何一个,以使参数保持默认状态。这里我们将 描述图形 的字体设置为粗体。
By default the text in lasthopcount is static, but we’ll change it when a message arrives. This is done in txc17.cc, in the handleMessage() function.
默认情况下, lasthopcount 中的文本是静态的,但我们会在消息到达时更改它。这是在txc17.cc中的 handleMessage() 函数中完成的。
if(hasGUI()){
            char label[50];
            // Write last hop count to string 将最后一跳计数写入字符串
            sprintf(label, "last hopCount = %d", hopCount);
            // Get pointer to figure 获取指向图形的指针
            cCanvas *canvas = getParentModule()->getCanvas(); // 获取画布指针
            cTextFigure *textFigure = check_and_cast<cTextFigure*>(canvas->getFigure("lasthopcount")); // 获取 图形指针,然后将 其 强制类型转换为 文本图形指针
            // Update figure text 更新图形文本
            textFigure->setText(label);
        }
The figure is represented by the cTextFigure C++ class. There are several figure types, all of them are subclassed from the cFigure base class. We insert the code responsible for updating the figure text after we retreive the hopcount variable.
该图由 cTextFigure C++类表示。有几种图形类型,它们都是从 cFigure 基类派生的。我们在检索 hopcount 变量后 插入 负责更新 图形文本的代码。
We want to draw the figures on the network’s canvas. The getParentModule() function returns the parent of the node, ie. the network. Then the getCanvas() function returns the network’s canvas, and getFigure() gets the figure by name. Then, we update the figure’s text with the setText() function.
我们想在网络的画布上画出这些图形。getParentModule() 函数返回节点的父节点,即网络。然后, getCanvas() 函数返回网络的画布, getFigure() 按名称获取图形。然后,我们使用 setText() 函数更新图形的文本。
| Tip 提示 |
|---|
| For more information on figures and the canvas, see The Canvas section of the OMNeT++ manual |
| 有关图形和画布的更多信息,请参见OMNeT++手册的画布部分 |
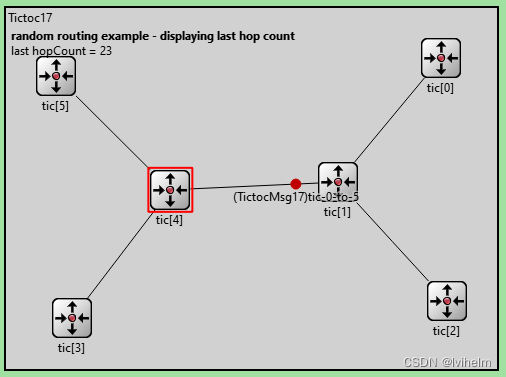
When you run the simulation, the figure displays ‘last hopCount: N/A’ before the arrival of the first message. Then, it is updated whenever a message arrives at its destination.
当您运行模拟时,图中显示第一条消息到达前的“last hopCount:N/A”。然后,每当消息到达其目的地时,它都会更新。
提示:这是我自己运行仿真得到的截图,为了避免结点数组重叠,不设置@display属性可能更好?
| Tip 提示 |
|---|
If the figure text and nodes overlap, press ‘re-layout’. |
| 如果图形文本和节点重叠,请按“重新布局”。 |
In the last few steps, we have collected and displayed statistics. In the next part, we’ll see and analyze them in the IDE.
在最后几个步骤中,我们收集并显示了统计数据。在下一部分中,我们将在IDE中查看并分析它们。
Sources: tictoc17.ned, txc17.cc, omnetpp.ini
源(代码):tictoc17.ned, txc17.cc, omnetpp.ini
二、补充内容
为了辨析教程中涉及到的概念,以下是本人查阅仿真手册得到的相关内容,以及询问AI得到的回答。
1. 信号的本质
根据仿真手册的4.14节的第3段可知
信号由组件(模块和通道)发射。信号 在模块层次结构上 向上 传播到根。在任何级别,都可以注册侦听器,即具有回调方法的对象。这些侦听器都会收到通知(调用其相应的方法),每当1个信号值被发出时。向上传播的结果是,在复合模块处注 册的侦听器 可以接收 来自此子模块树中 所有组件的信号。在系统模块内 注册的侦听器 可以 接收来自整个仿真的信号。
Signals are emitted by components (modules and channels). Signals propagate on the module hierarchy up to the root. At any level, one can register listeners, that is, objects with callback methods. These listeners will be notified (their appropriate methods called) whenever a signal value is emitted. The result of upwards propagation is that listeners registered at a compound module can receive signals from all components in that submodule tree. A listener registered at the system module can receive signals from the whole simulation.
总结
提示:这里对文章进行总结:
终于完成了第6篇,也许并没有什么大的用处,但也是一种自我学习的过程,也是对自己的学习心得的一种记录,最后如果能对读者有点用处的话,那就再好不过了😂。


 1878
1878

 被折叠的 条评论
为什么被折叠?
被折叠的 条评论
为什么被折叠?
 到【灌水乐园】发言


