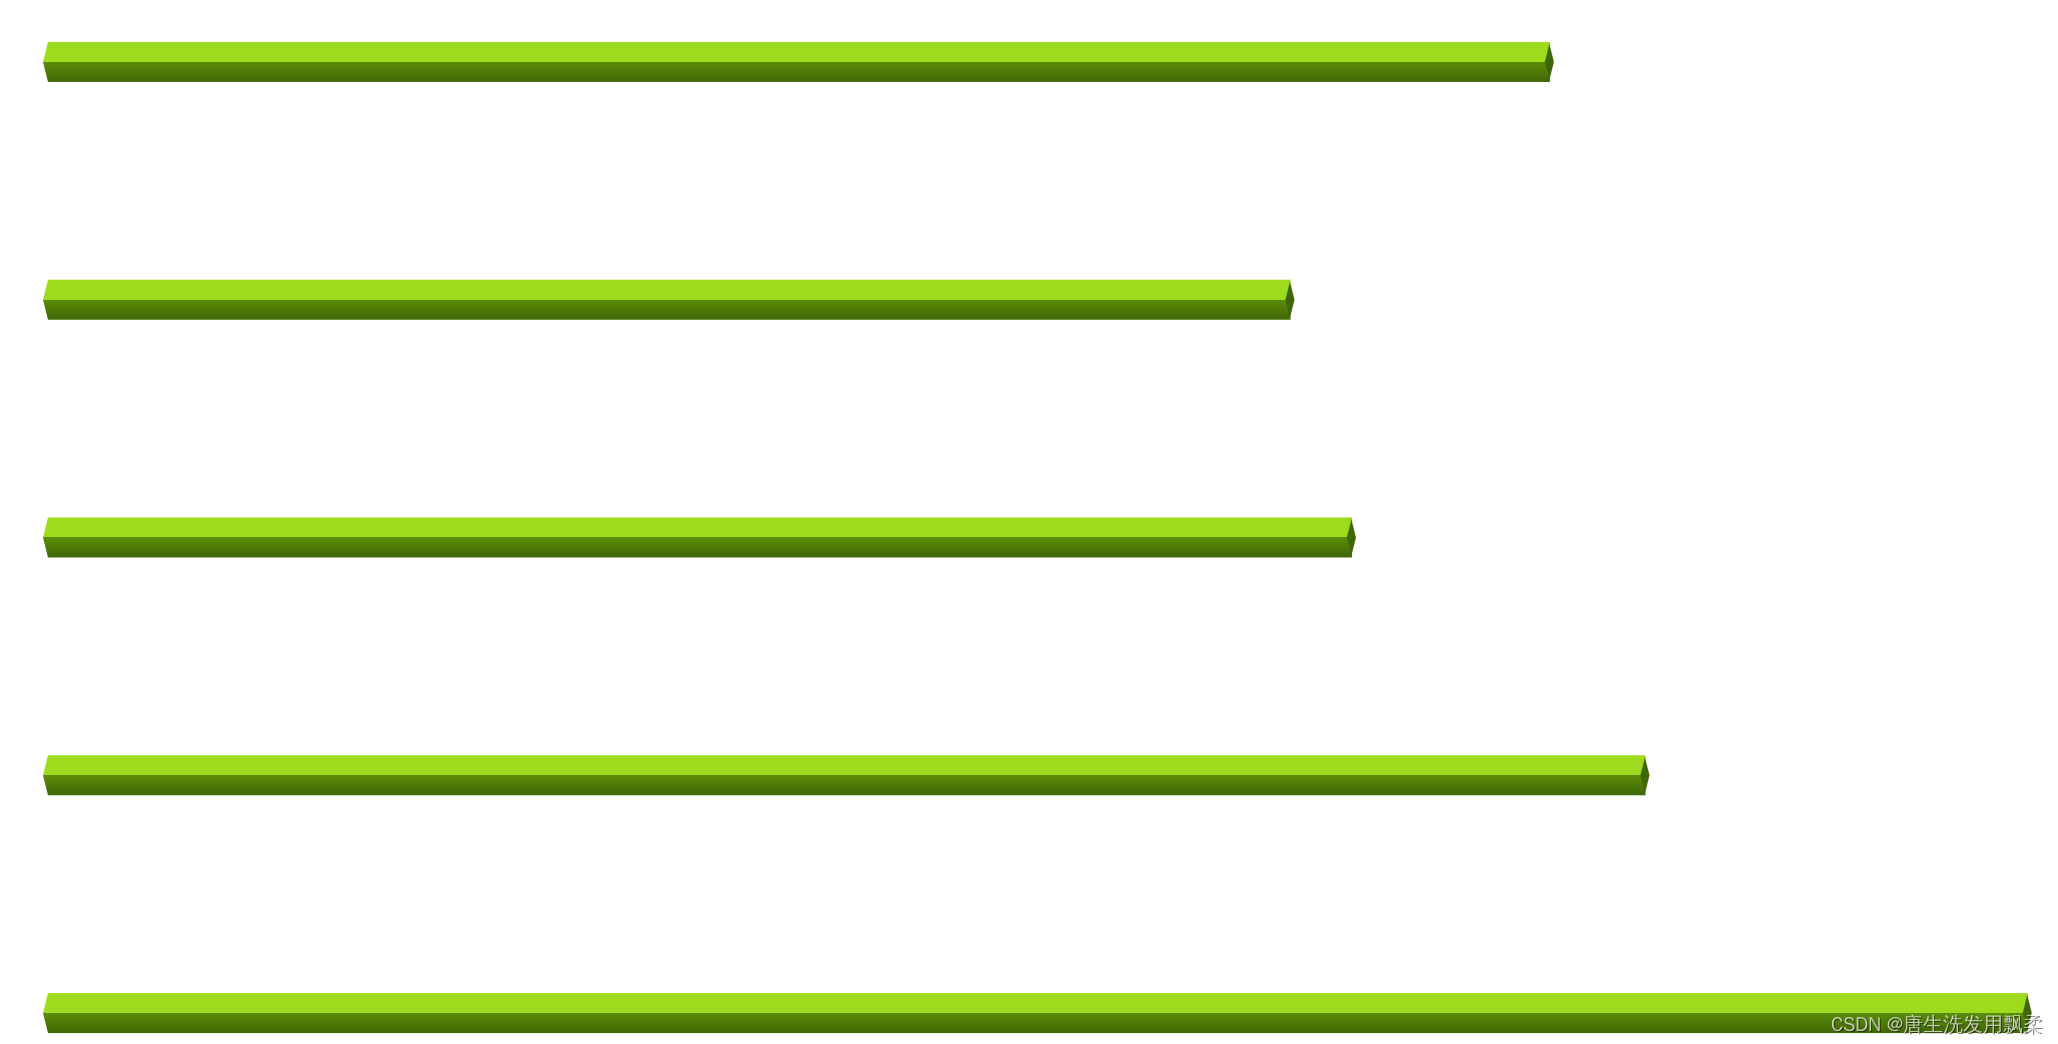
代码效果图如下
<template>
  <div ref="chartDiv" class="chartDiv"> </div>
</template>

<script>
var data = [220, 182, 191, 234, 290];
var sum = eval(data.join('+'));
var colors = [{
  type: 'linear',
  x: 0,
  x2: 0,
  y: 0,
  y2: 1,
  colorStops: [{
    offset: 0,
    color: '#a0d911'
  }, {
    offset: 0.5,
    color: '#a0d911'
  }, {
    offset: 0.5,
    color: '#5b8c00'
  }, {
    offset: 1,
    color: '#3f6600'
  }]
}];


var barWidth = 40;
export default {
  data(){
    return {
      option:{
        textStyle: {
          color: '#fff',
          fontSize: 16,
        },
        grid: {
          top: '5%',
          bottom: '5%',
          left: '10%',
          right: '10%'
        },
        yAxis: {
          inverse: true,
          offset: 3,
          axisLine: {
            show: 0
          },
          axisTick: {
            show: 0
          },
          axisLabel: {
            fontSize: 16,
          },
          data: ['A', 'B', 'C', 'D', 'E'],
        },
        xAxis: {
          axisLabel: {
            show: 0
          },
          axisLine: {
            show: 0
          },
          axisTick: {
            show: 0
          },
          splitLine: {
            show: 0
          }
        },
        series: [
          {
            z: 1,
            type: 'bar',
            barWidth: barWidth,
            data: [220, 182, 191, 234, 290],
            itemStyle: {
              normal: {
                color: colors[0]
              }
            },
          }, {
            z: 2,
            name: '底部',
            type: 'pictorialBar',
            data: [1, 1, 1, 1, 1],
            symbol: 'diamond',
            symbolOffset: ['-50%', 0],
            symbolSize: [10, barWidth],
            itemStyle: {
              normal: {
                color: colors[0]
              }
            },
          },
          {
            z: 3,
            name: '上部1',
            type: 'pictorialBar',
            symbolPosition: 'end',
            data: data,
            symbol: 'diamond',
            symbolOffset: ['50%', 0],
            symbolSize: [10 * (barWidth - 4) / barWidth, barWidth - 4, ],
            itemStyle: {
              normal: {
                borderColor: '#3f6600',
                borderWidth: 2,
                color: '#3f6600'
              }
            },
            label: {
              show: true,
              position: 'right',
              formatter: p => {
                return (p.value / sum * 100).toFixed(2) + '%';
              },
              fontSize: 16,
              color: '#fff'
            },
          }
        ]
      },
      myChart: null,
      timeInterval: null,
    }
  },

  mounted() {
    this.initChart()
  },
  methods:{
    initChart(){
      const chartDom = this.$refs.chartDiv
      this.myChart = this.$echarts.init(chartDom)
      this.myChart.setOption(this.option)

      window.addEventListener("resize", () => {
        this.myChart.resize();
      });
    }
  }
}
</script>

<style lang="less" scoped>
.chartDiv{
  height: 100%;
  width: 100%;
}
</style>


 1万+
1万+


 被折叠的 条评论
为什么被折叠?
被折叠的 条评论
为什么被折叠?
 到【灌水乐园】发言


