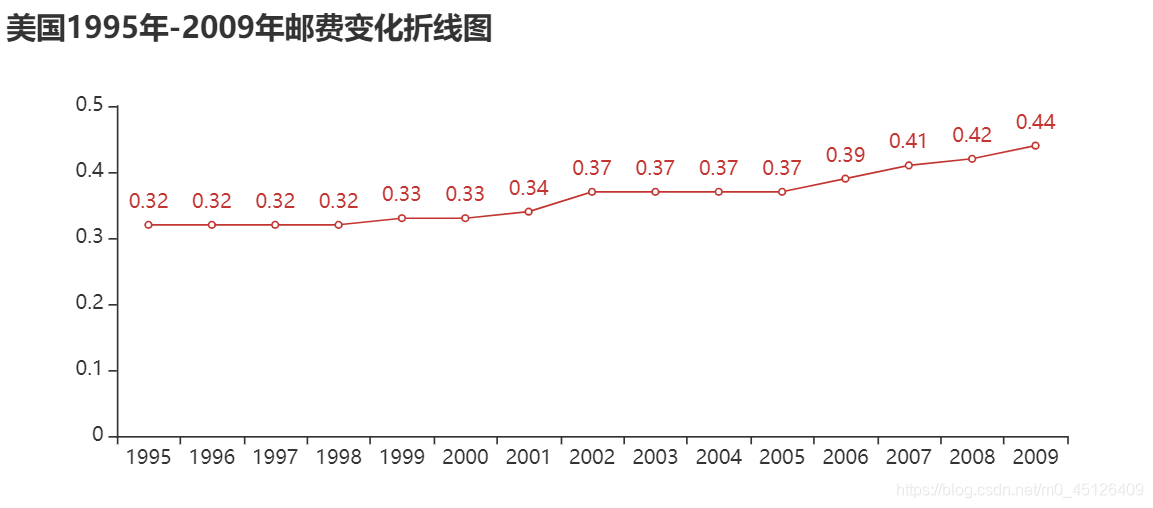
- 美国1995年-2009年邮费变化折线图、阶梯图;
数据如下:
年份 : [“1995”, “1996”, “1997”, “1998”, “1999”, “2000”,
“2001”, “2002”, “2003”, “2004”, “2005”, “2006”,
“2007”, “2008”, “2009”]
邮费: [0.32, 0.32, 0.32, 0.32, 0.33, 0.33, 0.34, 0.37, 0.37, 0.37, 0.37, 0.39, 0.41, 0.42, 0.44]
from pyecharts.charts import Line
import pyecharts.options as opts
year=["1995", "1996", "1997", "1998", "1999", "2000","2001", "2002", "2003", "2004", "2005", "2006","2007", "2008", "2009"]
postage=[0.32, 0.32, 0.32, 0.32, 0.33, 0.33, 0.34, 0.37, 0.37, 0.37, 0.37, 0.39, 0.41, 0.42, 0.44]

line1=(Line(init_opts=opts.InitOpts(width='720px',height='320px'))
     .add_xaxis(xaxis_data=year)
     .add_yaxis(series_name='',y_axis=postage)
     .set_global_opts(title_opts=opts.TitleOpts(title='美国1995年-2009年邮费变化折线图'))
     )
line1.render('美国1995年-2009年邮费变化折线图.html') # 在当前目录下存为html文件
line1.render_notebook()
from pyecharts.charts import Line
import pyecharts.options as opts
year=["1995", "1996", "1997", "1998", "1999", "2000","2001", "2002", "2003", "2004", "2005", "2006","2007", "2008�


 最低0.47元/天 解锁文章


 3308
3308


 被折叠的 条评论
为什么被折叠?
被折叠的 条评论
为什么被折叠?
 到【灌水乐园】发言


