


@[TOC] 降维方法笔记:探索性图论分析(Exploratory Graph Analysis)
原理介绍
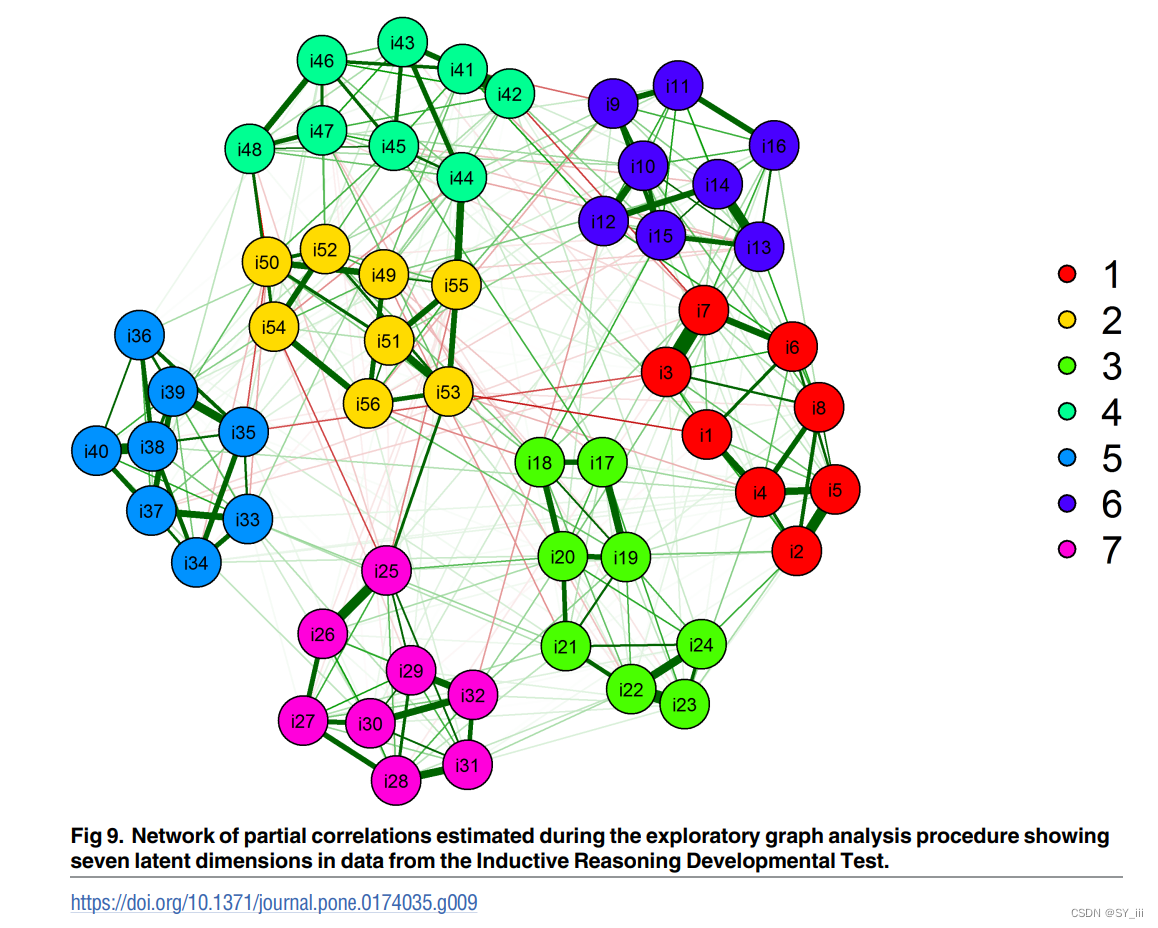
探索性图论分析(Exploratory Graph Analysis,EGA)1是心理学研究中一种比较新的估计维度的方法。
优势:除了估计维度数量,还可以估计单个条目属于哪个维度,因子数量多且相关高的情况,对维度的估计比传统方法更加准确;EGA不需要对数据做出强假设,适用于各种类型的数据集。
思路:**把因子当作网络中的一个节点(node),潜变量就是网络中的一个集群(cluster)。**通常使用相关矩阵构建图,图中的节点代表变量,边代表变量之间的相关性。边的权重通常基于相关系数的绝对值。为了提高图的可解释性,通常会使用稀疏化技术,如thresholding或正则化(LASSO)等,去除弱相关的边、只保留强相关的边。然后使用图聚类算法(如Walktrap、Louvain等)识别图中的社区/模块;最后进行潜变量的定义与解释。
比如“基于EBIC指定的正则化参数的graphical lasso。维度的数量通过walktrap(一种用于识别网络中的社区的随机行走算法)等来验证。”
在因子分析中会假设个体行为 = 多个潜变量的线性加和+随机误差。而EGA不依赖于线性关系或正态分布假设,纯粹基于数据的相关性。其原理是构建相关矩阵、求逆相关矩阵、标准化精度矩阵以得到偏相关系数矩阵(修正边的权重使其更加反应两个节点间的相关)但偏相关的问题是在过拟合时可能会反映虚假的相关性、导致图中出现虚假的边,而LASSO等正则化方法的使用可以减少过拟合的可能性,从而提高网络的可解释性。
对Walktrap, TMFG (triangulated maximally filtered graph)等的介绍可以看Golino(2020)23,Christensen(2023)比较推荐Fast-greedy, Louvain, and Walktrap 与 GLASSO结合4
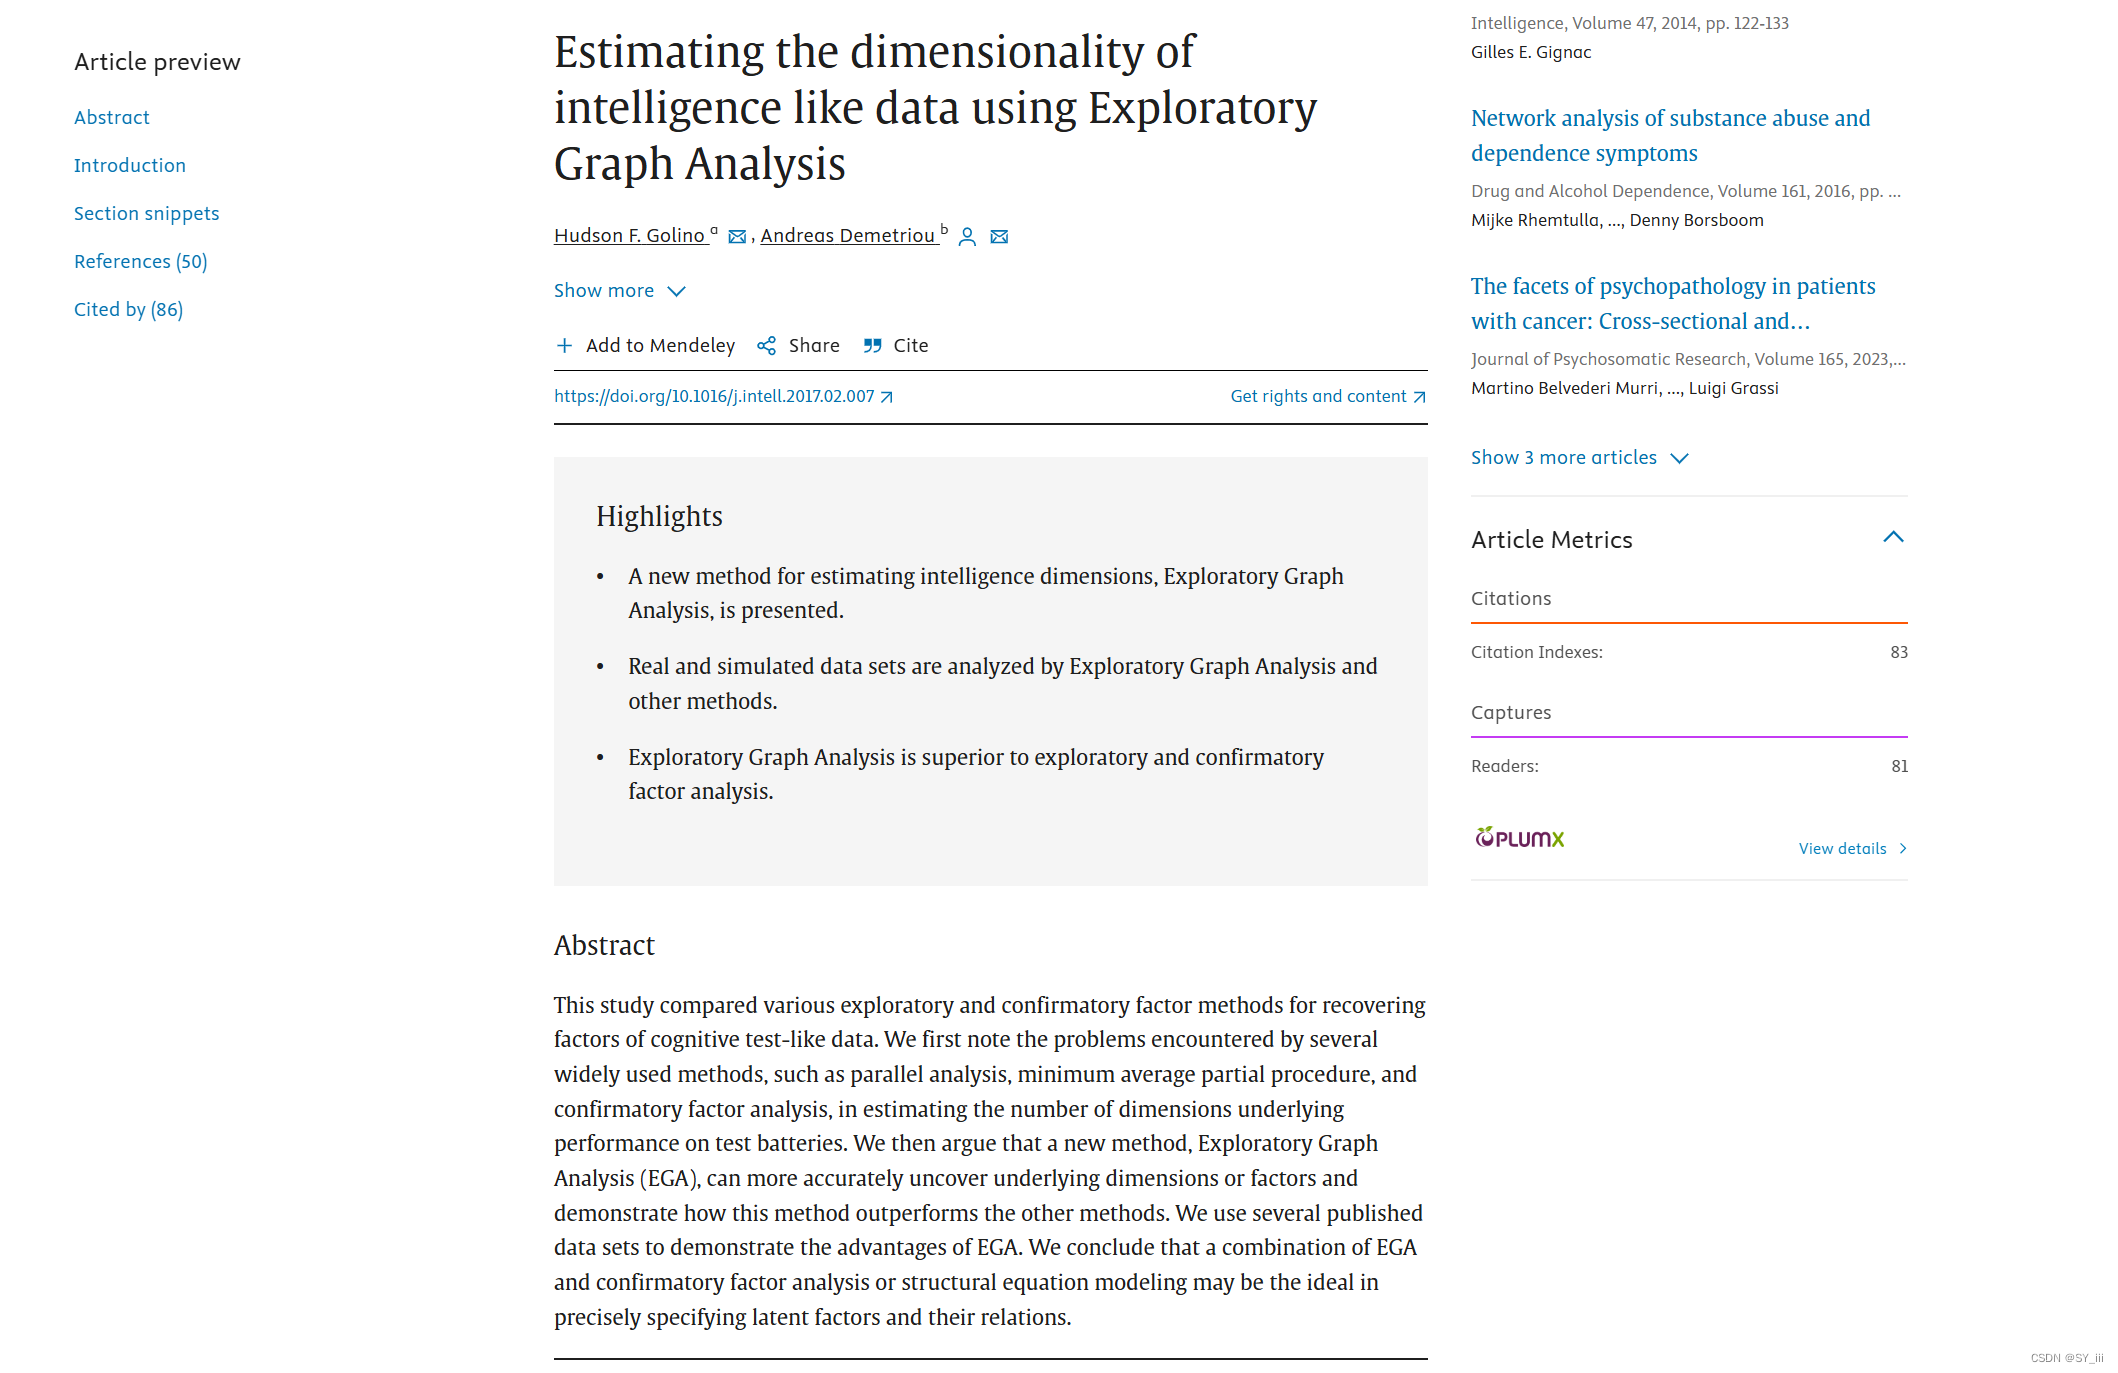
和传统探索性分析的比较
https://doi.org/10.1016/j.intell.2017.02.007
代码实现
https://github.com/hfgolino/EGAnet
https://search.r-project.org/CRAN/refmans/EGAnet/html/EGA.html
安装
if(!"devtools" %in% row.names(installed.packages())){
  install.packages("devtools")
}

devtools::install_github("hfgolino/EGAnet")
参数解释
EGA(
  data,
  n = NULL,
  corr = c("auto", "cor_auto", "pearson", "spearman"),
  na.data = c("pairwise", "listwise"),
  model = c("BGGM", "glasso", "TMFG"),
  algorithm = c("leiden", "louvain", "walktrap"),
  uni.method = c("expand", "LE", "louvain"),
  plot.EGA = TRUE,
  verbose = FALSE,
  ...
)
| 参数 | 说明 |
|---|---|
| data | 矩阵或dataframe,可以是raw data或相关矩阵 |
| n | 数值型,如果[data]提供的是相关矩阵,则n为样本量(sample size) |
| corr | 字符型,默认是"auto",即根据数据类型选择对应的分析,如果选择了pearson, spearman,则无视数据类型;如果用其他相似性分析,先计算,再赋值给[data]和[n] |
| na.data | 缺失值的处理方式,默认的“pairwise"计算两个配对变量的相关值,"listwise"计算数据集中全部的相关值 |
| model | 选择graphical analysis模型,默认"glasso",即 GLASSO with EBIC model selection,调用EBICglasso.qgraph;"BGGM"是(Bayesian Gaussian Graphical Model)调用BGGM::estimate;"TMFG"调用TMFG,稳健性更高 |
| algorithm | community detection方法,默认"walktrap",还可以选"leiden", "louvain"等,如果是unidimensional的不建议walktrap |
| uni.method | 默认"louvain",如果维度为1则用louvain solution,否则用regular EGA (Christensen’s (2022) );“expand”;"LE"是在维度为1时用Leading Eigenvector algorithm (cluster_leading_eigen) |
| plot.EGA | 布尔值,默认为"TRUE",会生成图 |
| verbose | 布尔值,默认为"FALSE",即不重要提醒不输出 |
| auto.correlate, network.estimation, community.detection, community.consensus, community.unidimensional | 已经弃用 |
输出
| 变量 | 解释 |
|---|---|
| network | 对称网络 |
| wc | 呈现每个社区(维度)的成分,NA表示该节点不属于网络 |
| n.dim | 维度数量 |
| correlation | 0阶相关矩阵 |
| n | |
| dim.variables | |
| TEFI |
相关研究
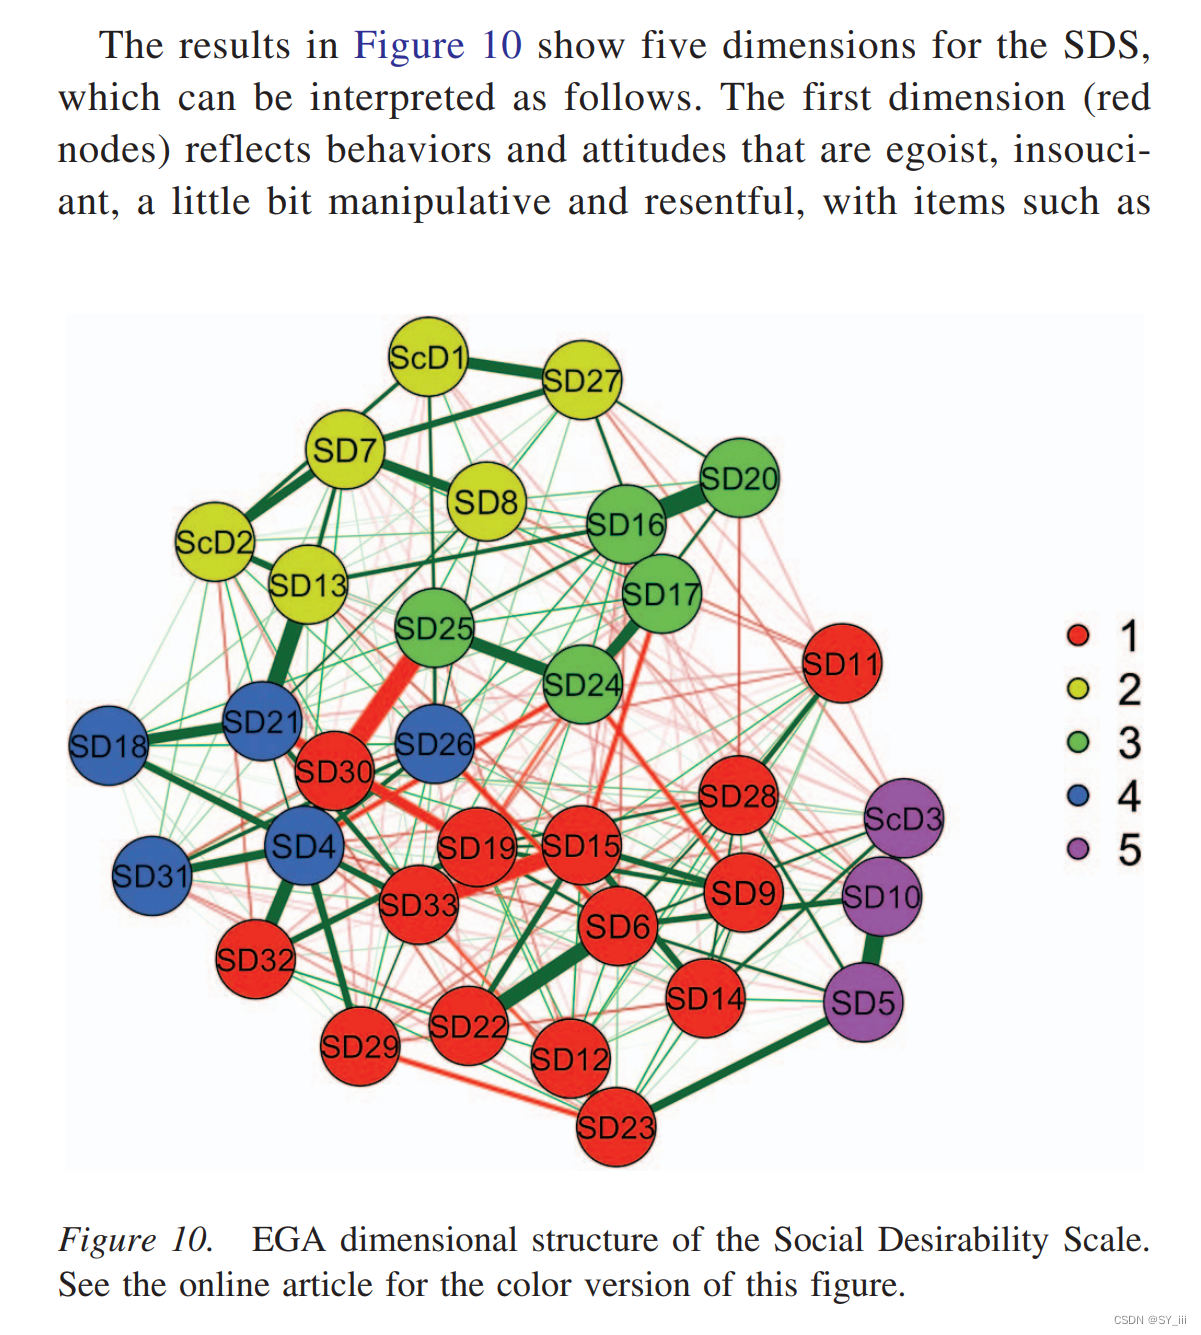
Social desirability scale (Golino,2020)
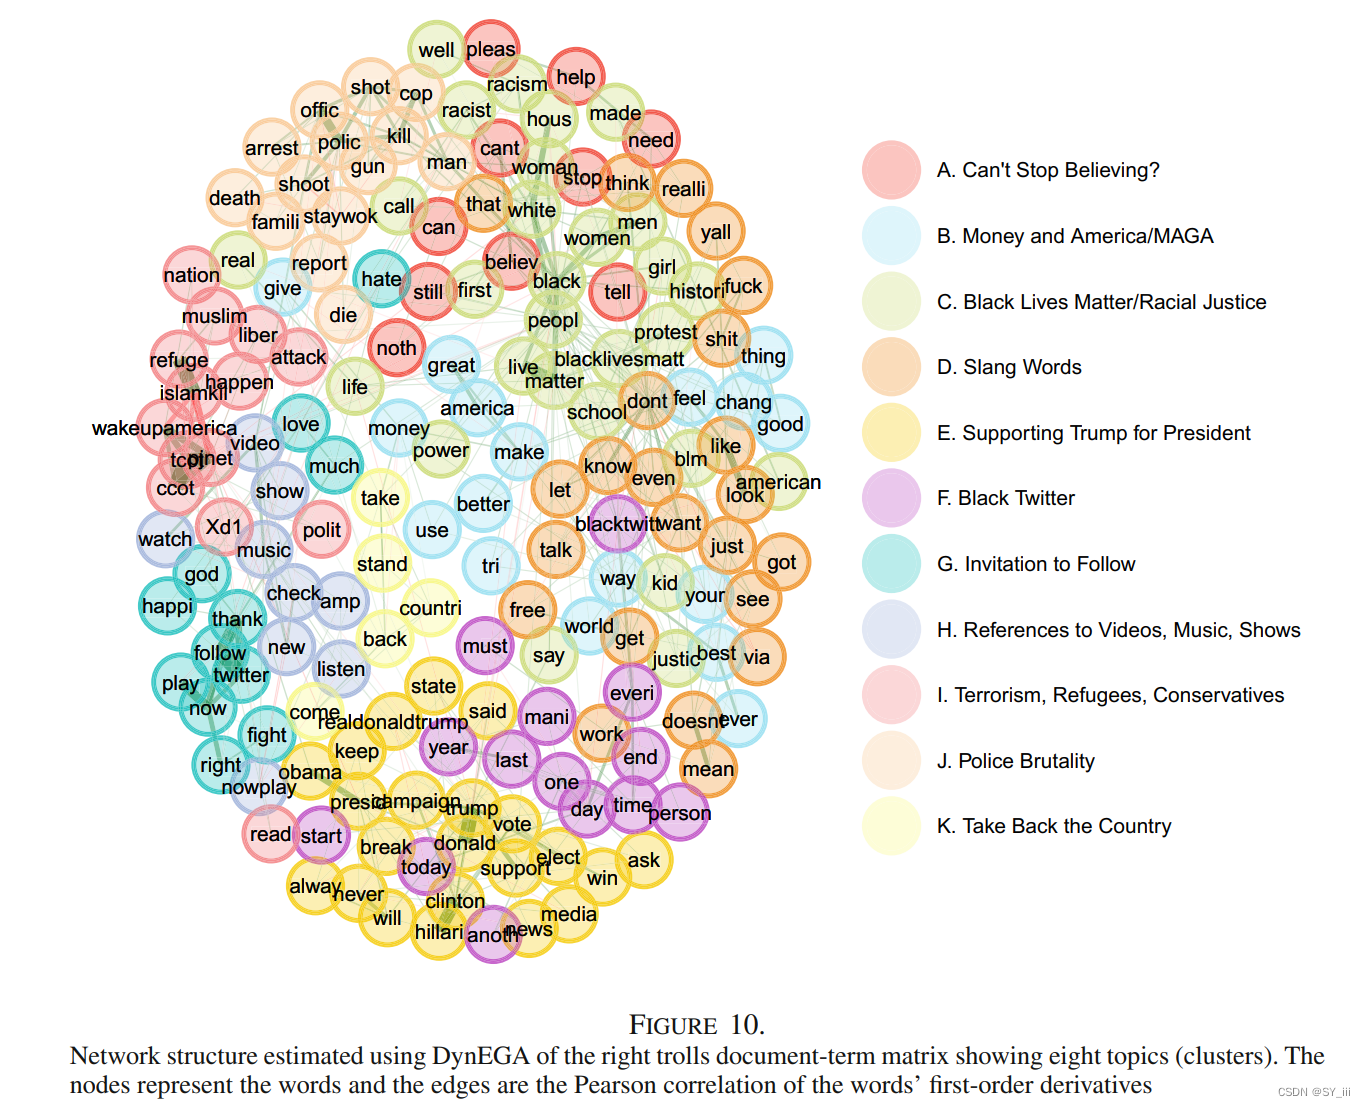
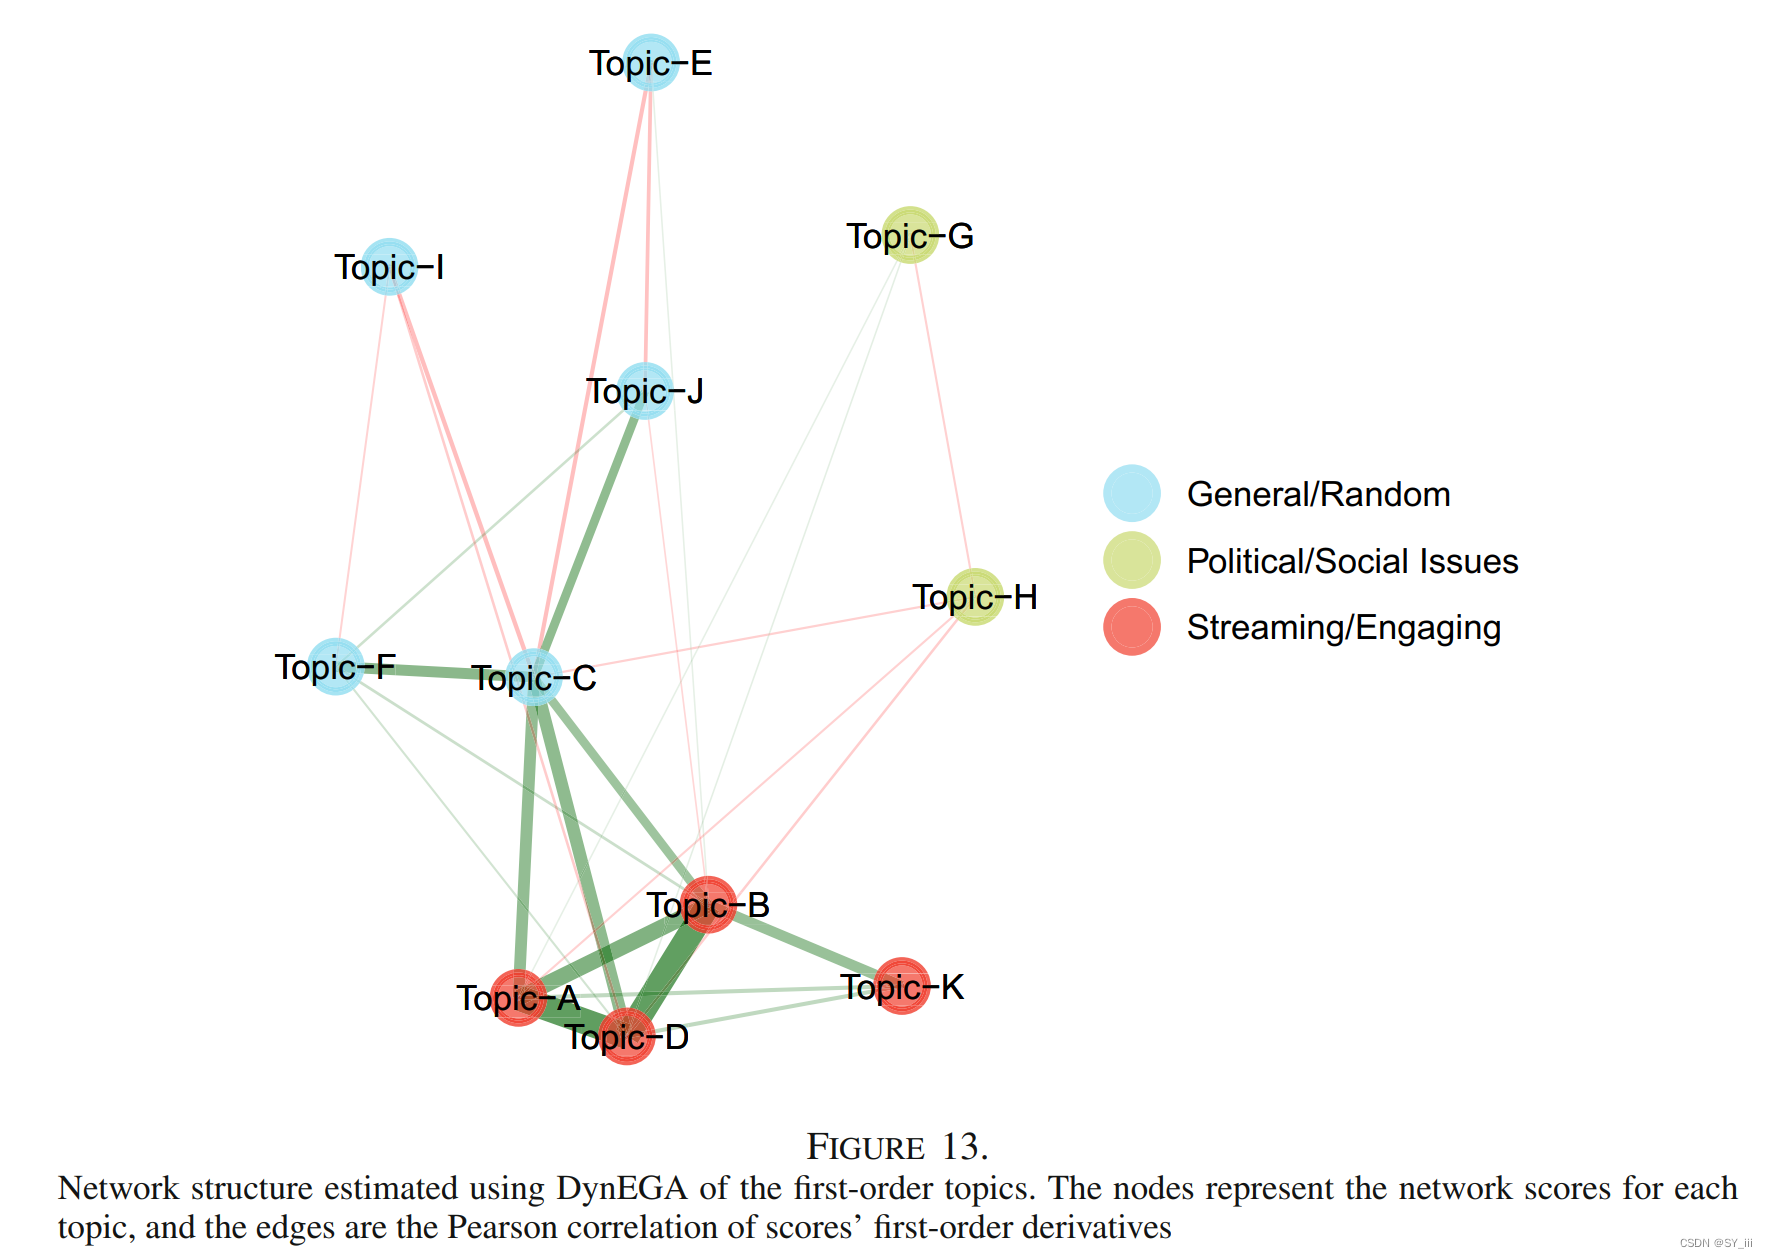
Dynamic Exploratory Graph Analysis (Golino, 2022)3
分析对象:推特文本
network estimation: GLASSO, TMFG
community detection: Walktrap
dynamic体现在加入了时间维度,EGA使用的是原始的相关矩阵,而DynEGA使用的是经过GLLA估计的n阶导数。document-term matrix (DTM)是一个N × K的矩阵,N是时间点数量,K是语料库中单个词词频;随着时间迭代,就会生成一个延时的embedding矩阵(time-delay embedding matrix);然后利用GLLA技术估计词频随时间变化(±一阶导数)和变化速度(±二阶导数)
代码:https://osf.io/4ya6x/?view_only=b6078b404e3049818b359ae0d514f966
Golino HF, Epskamp S (2017) Exploratory graph analysis: A new approach for estimating the number of dimensions in psychological research. PLoS ONE 12(6): e0174035. https://doi.org/10.1371/journal.pone.0174035 ↩︎
Golino, H., Shi, D., Christensen, A. P., Garrido, L. E., Nieto, M. D., Sadana, R., Thiyagarajan, J. A., & Martinez-Molina, A. (2020). Investigating the performance of exploratory graph analysis and traditional techniques to identify the number of latent factors: A simulation and tutorial. Psychological Methods, 25(3), 292–320. https://doi.org/10.1037/met0000255 ↩︎
Golino, H., Christensen, A.P., Moulder, R. et al. Modeling Latent Topics in Social Media using Dynamic Exploratory Graph Analysis: The Case of the Right-wing and Left-wing Trolls in the 2016 US Elections. Psychometrika 87, 156–187 (2022). https://doi.org/10.1007/s11336-021-09820-y ↩︎ ↩︎
Christensen, A.P., Garrido, L.E., Guerra-Peña, K. et al. Comparing community detection algorithms in psychometric networks: A Monte Carlo simulation. Behav Res 56, 1485–1505 (2024). https://doi.org/10.3758/s13428-023-02106-4 ↩︎


 1532
1532

 被折叠的 条评论
为什么被折叠?
被折叠的 条评论
为什么被折叠?
 到【灌水乐园】发言


