


Principles of Analytic Graphics 分析图表的原则
1、Show Comparisons 显示对比
2、Show causality,mechanism,explanation,systematic structure
显示因果关系,结构,解释,系统结构
3、Show multivariate data 显示多元数据(在图表中引用多维度)
4、Integration of evidence 证据整合(用各种model表现)
5、Describe and document the evidence with appropriate labels,scales,sources,etc
用合适的标签、计量单位、来源,阐述和说明证据
6、Content is king 内容为王
----------------------------------------------------------------
exploratory graphs 探索性图表
1维
summary() 6数概括
boxplot(x,col);abline(h,v,lwd) 箱图;基准线
hist(x,col,breaks);rug() 直方图;地毯图
barplot(x,col,main) 条形图
2维
boxplot(y~x,data,col) 箱图
par(mfrow,mar);hist(subset(x)$1,col) 分屏显示直方图
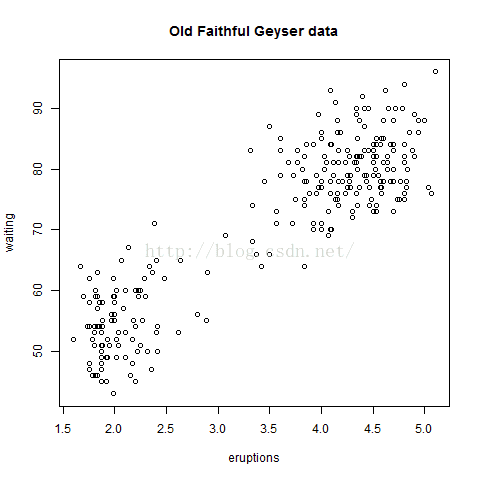
plot(x$1,x$2);abline(h,lwd,lty) 带基准线的散点图
resources网站资源
R Graph Gallery
R Bloggers
---------------------------------------------------------------------
绘图系统
hist(airquality$Ozone)直方图
boxplot(Ozone~Month,airquality)箱图
main 标题
type="n" 建立绘图区域,但不绘图
2、par() 参数
par()$pin查看某项参数
pch 绘图符号 example(plot)
lty 线条格式
lwd 线宽
col 颜色
xlab x轴标签
ylab y轴标签
las 轴位置
bg 背景颜色
mar 边距 下左上右
oma 外边距
mfrow mfcol 每行图表数量
3、lines() 线条
4、points() 点
col
5、text() 文本
6、title() 标题
mian
7、mtext() 边距文本
8、axis() 轴标、标签
9、legend() 图例
pch 符号
col 颜色
legend 图例名称
10、abline() 基准线
v h lwd lty
bwplot
dev.off()
dev.cur()查找当前输出端
dev.set(2)
dev.copy()
dec.copy2pdf
svg web格式支持交互
win.metafile Windows专用
postscript pdf前身
位图good for plots with a large number of points, natural scenes or web-based plots
png 大量点线图
jpeg 色彩丰富的图
tiff 旧的
bmp windoes专用
1、Show Comparisons 显示对比
2、Show causality,mechanism,explanation,systematic structure
显示因果关系,结构,解释,系统结构
3、Show multivariate data 显示多元数据(在图表中引用多维度)
4、Integration of evidence 证据整合(用各种model表现)
5、Describe and document the evidence with appropriate labels,scales,sources,etc
用合适的标签、计量单位、来源,阐述和说明证据
6、Content is king 内容为王
----------------------------------------------------------------
exploratory graphs 探索性图表
1维
summary() 6数概括
boxplot(x,col);abline(h,v,lwd) 箱图;基准线
hist(x,col,breaks);rug() 直方图;地毯图
barplot(x,col,main) 条形图
2维
boxplot(y~x,data,col) 箱图
par(mfrow,mar);hist(subset(x)$1,col) 分屏显示直方图
plot(x$1,x$2);abline(h,lwd,lty) 带基准线的散点图
resources网站资源
R Graph Gallery
R Bloggers
---------------------------------------------------------------------
绘图系统
1、base 艺术家的调色板
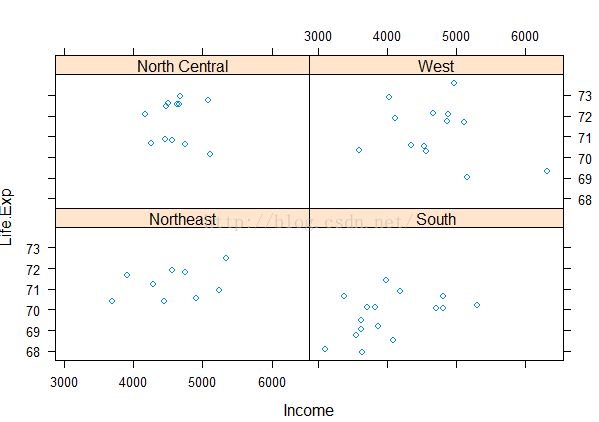
2、lattice 一次性作图 适合制作3D图和分组分析
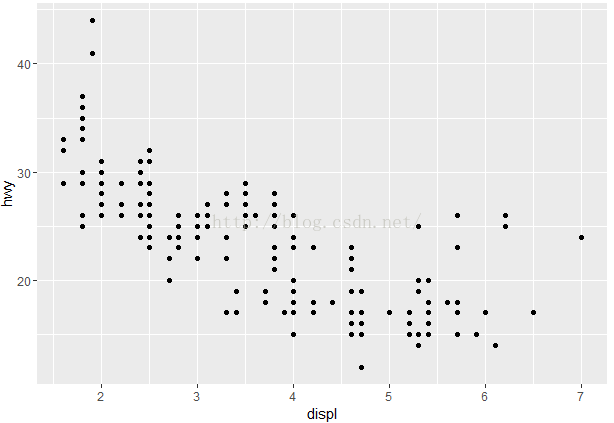
3、ggplot2 以上的结合"grammar of graphics"
base:绘图
1、plot() 基础绘图hist(airquality$Ozone)直方图
boxplot(Ozone~Month,airquality)箱图
main 标题
type="n" 建立绘图区域,但不绘图
2、par() 参数
par()$pin查看某项参数
pch 绘图符号 example(plot)
lty 线条格式
lwd 线宽
col 颜色
xlab x轴标签
ylab y轴标签
las 轴位置
bg 背景颜色
mar 边距 下左上右
oma 外边距
mfrow mfcol 每行图表数量
3、lines() 线条
4、points() 点
col
5、text() 文本
6、title() 标题
mian
7、mtext() 边距文本
8、axis() 轴标、标签
9、legend() 图例
pch 符号
col 颜色
legend 图例名称
10、abline() 基准线
v h lwd lty
--------------------------------------------------
lattice
xyplot(Life.Exp~Income|region,state,layout=c(2,2))bwplot
-------------------------------------------------
图片输出
?Devices 查看当前环境下可输出的方式dev.off()
dev.cur()查找当前输出端
dev.set(2)
dev.copy()
dec.copy2pdf
----------------------------------------------------------
输出类型
矢量图good for line drawings and plots with solid colors using a modest number of points
pdf("x.pdf") 建立pdf输出端svg web格式支持交互
win.metafile Windows专用
postscript pdf前身
位图good for plots with a large number of points, natural scenes or web-based plots
png 大量点线图
jpeg 色彩丰富的图
tiff 旧的
bmp windoes专用
3、ggplot2 以上的结合"grammar of graphics"


 220
220

 被折叠的 条评论
为什么被折叠?
被折叠的 条评论
为什么被折叠?
 到【灌水乐园】发言


