


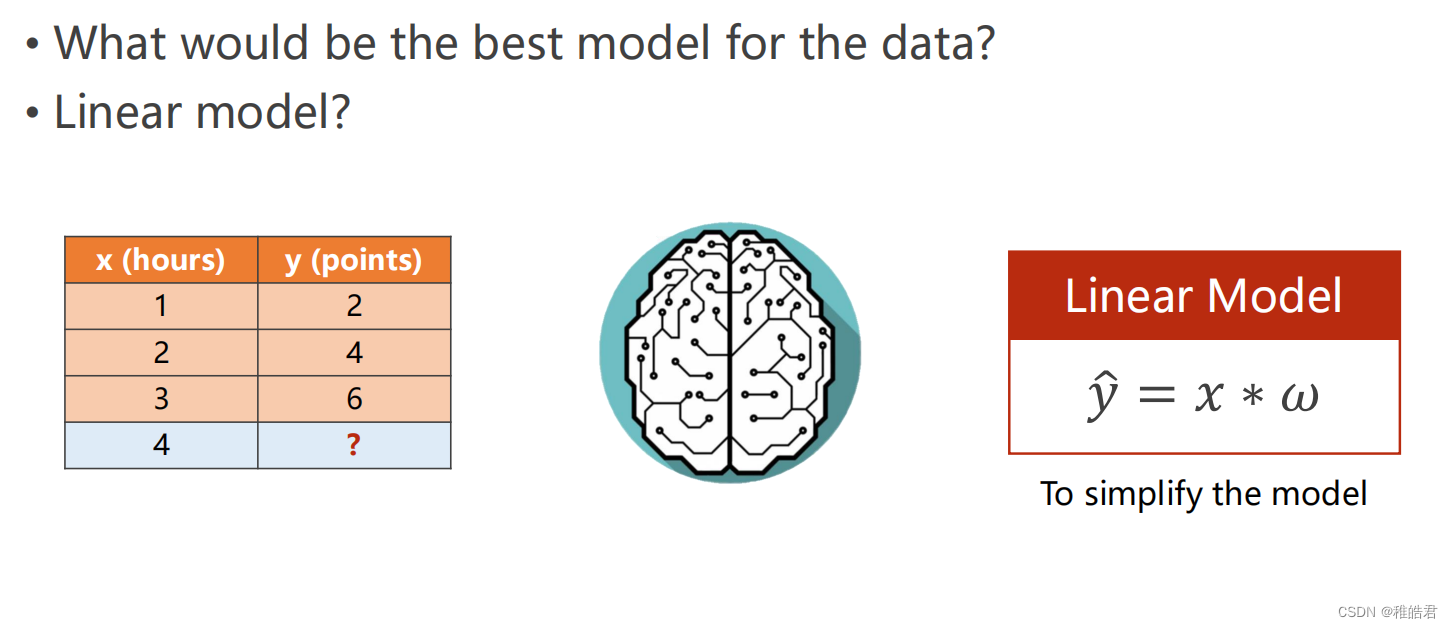
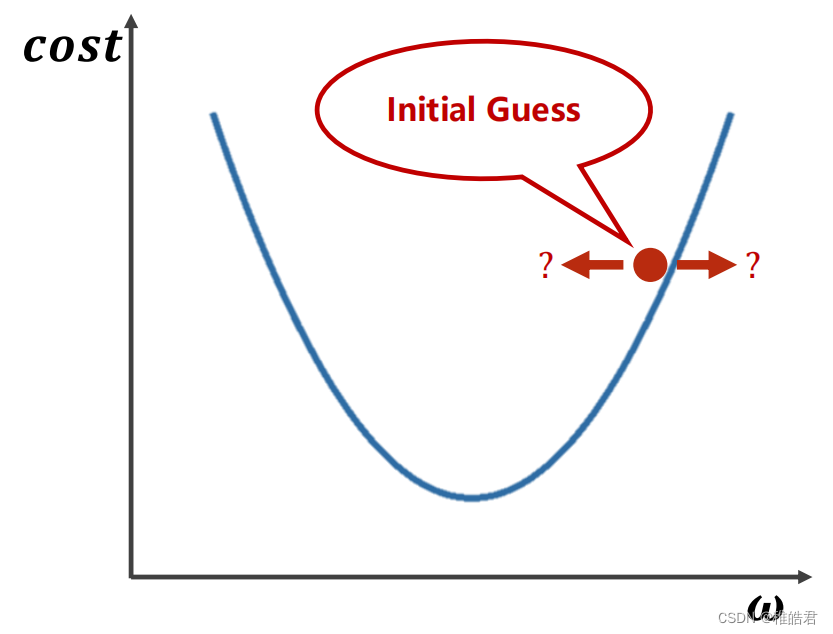
问题描述
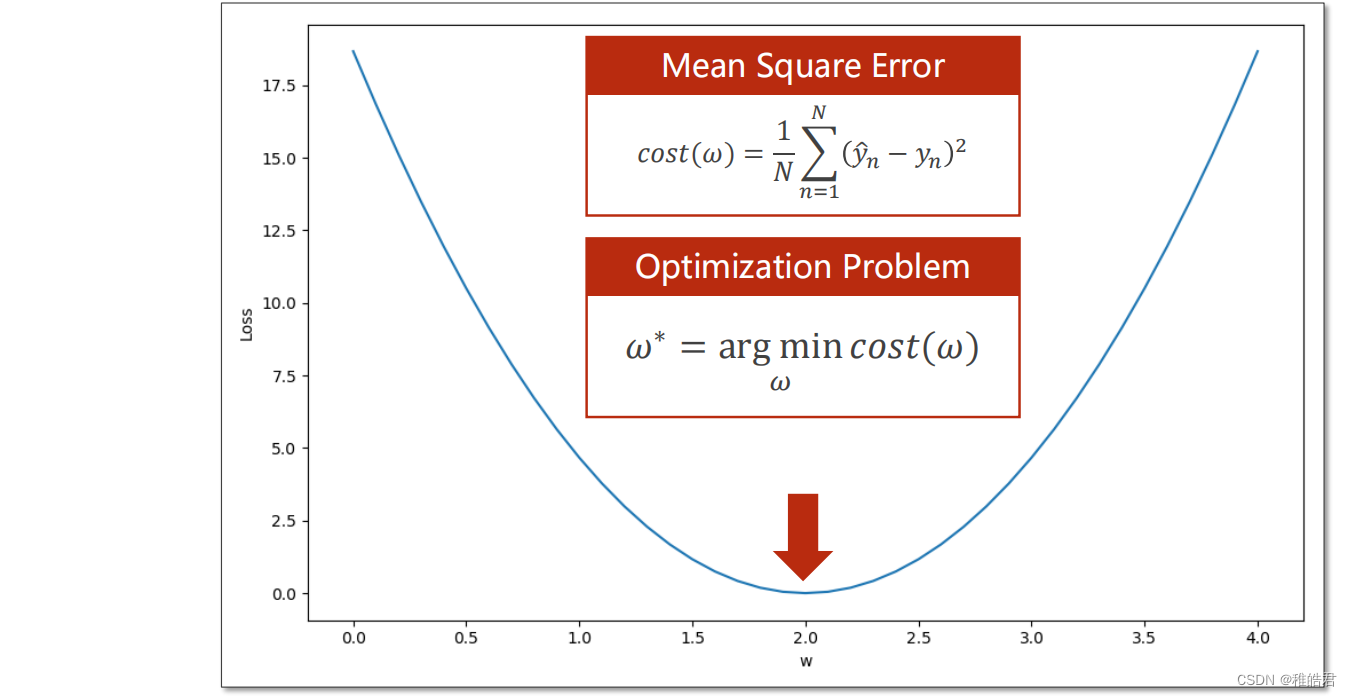
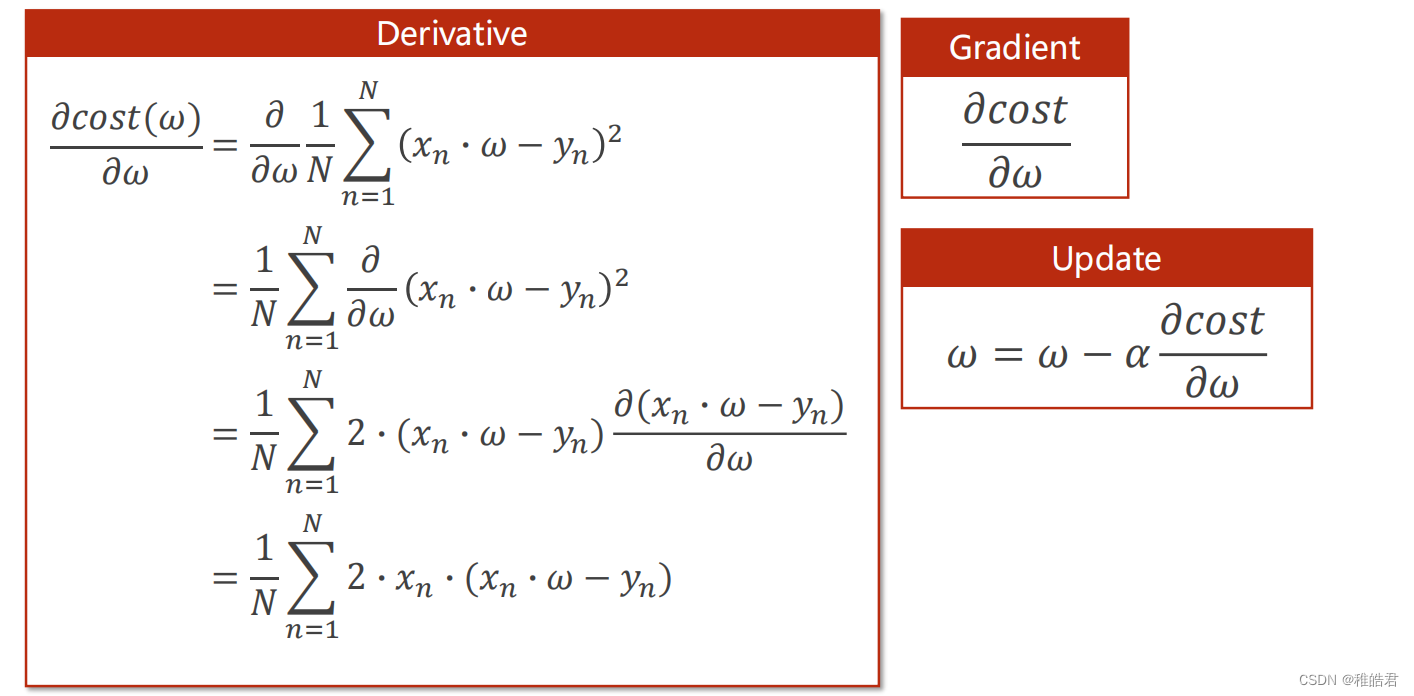
梯度下降
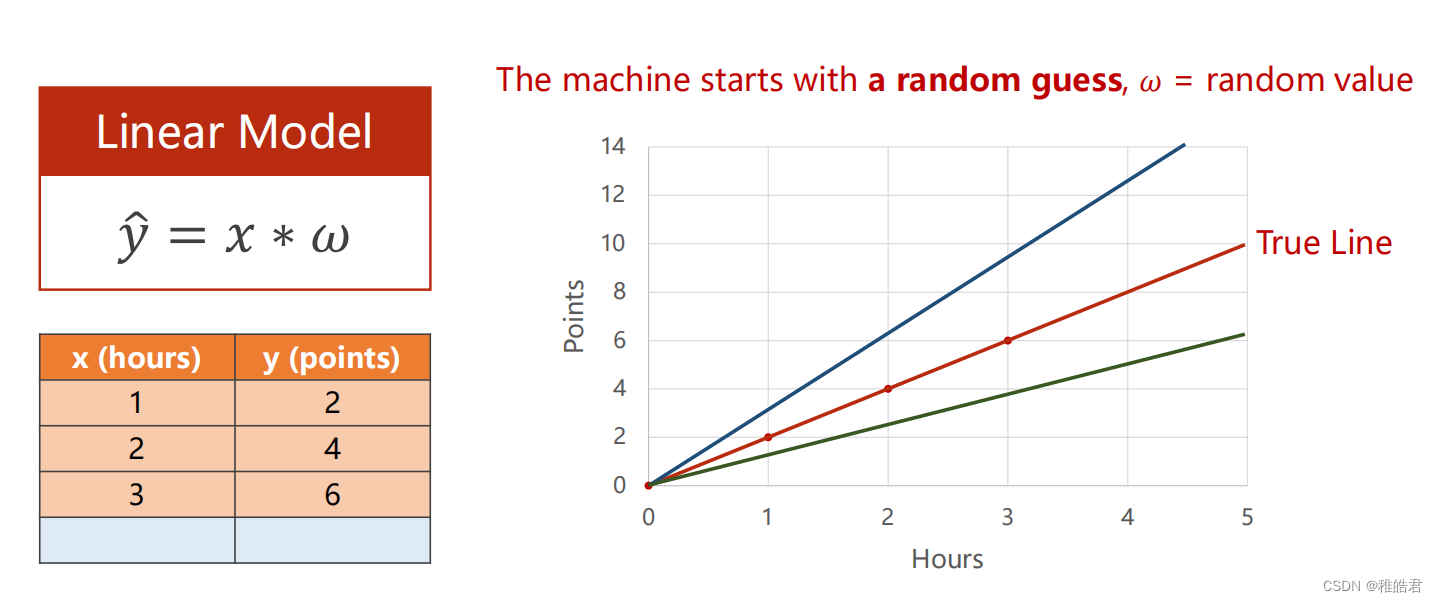
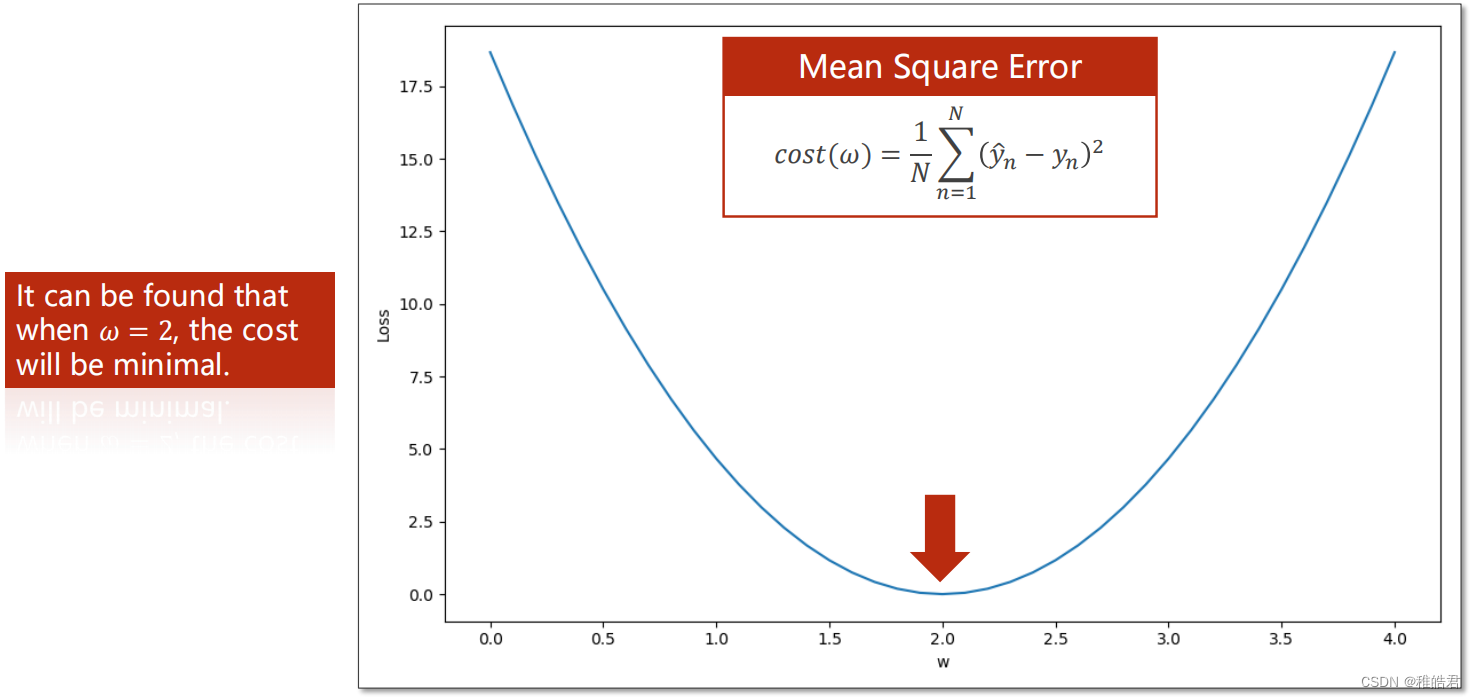
问题分析


编程实现

代码
import matplotlib.pyplot as plt
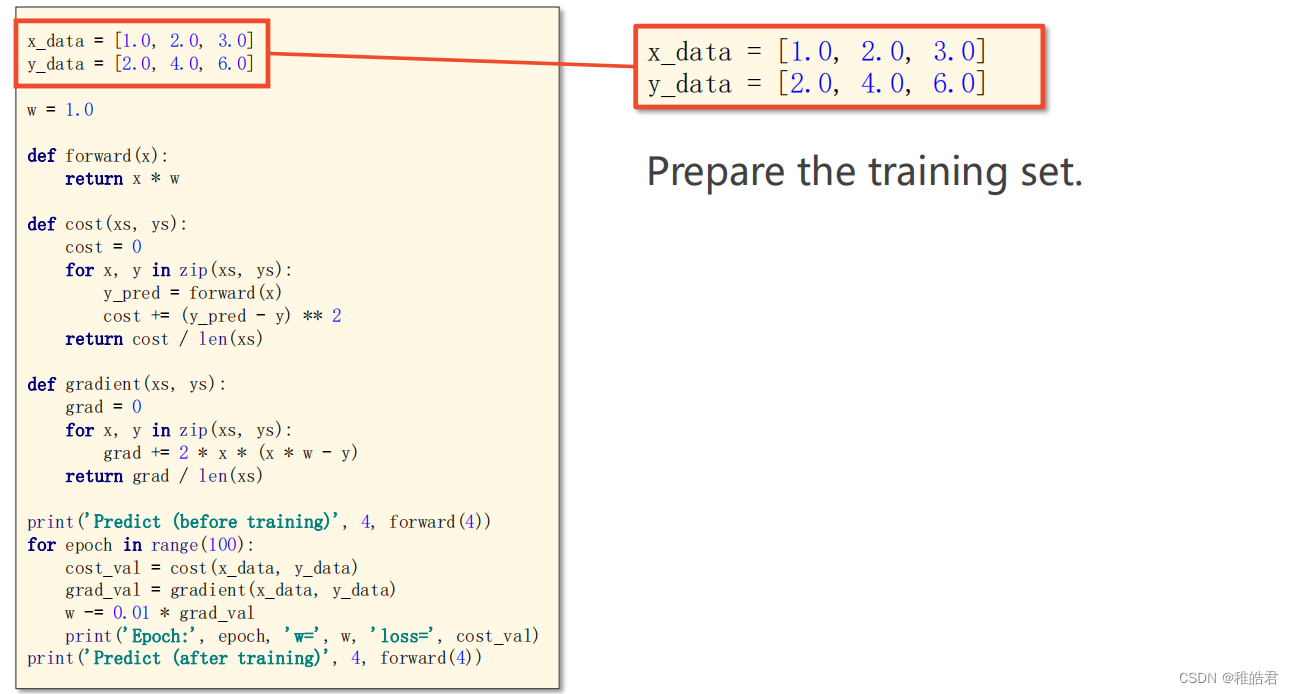
# 训练集数据
x_data = [1.0, 2.0, 3.0]
y_data = [2.0, 4.0, 6.0]
# 设置初始权重猜测
w = 1.0
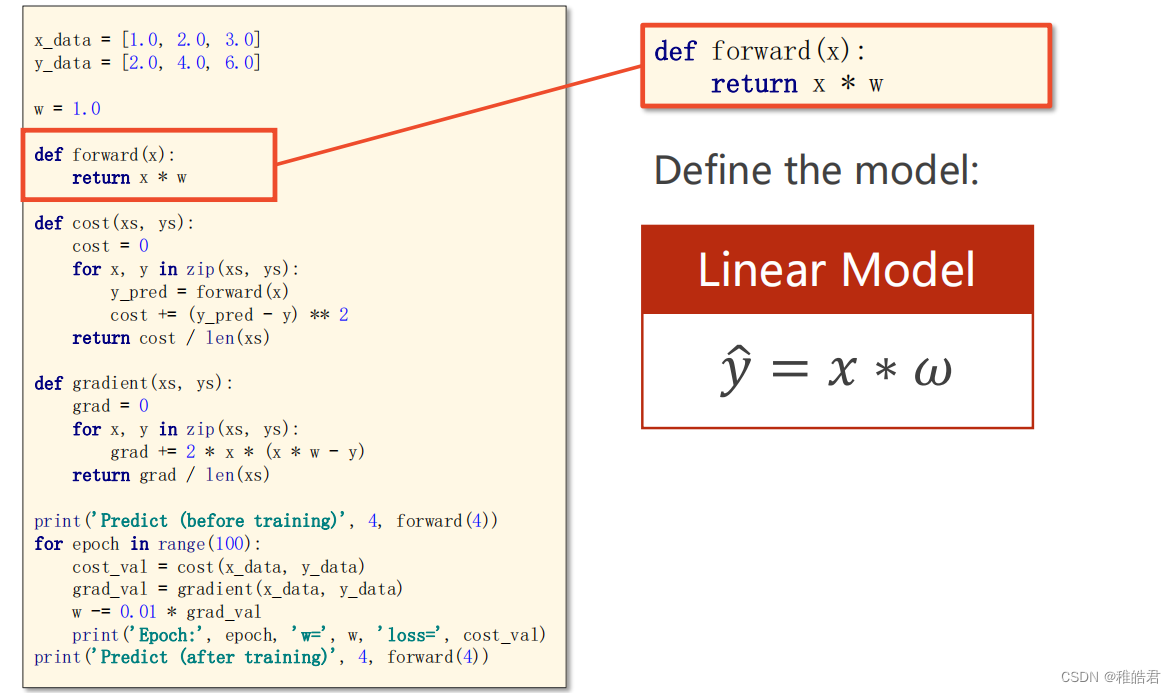
# 前馈计算
def forward(x):
return x * w
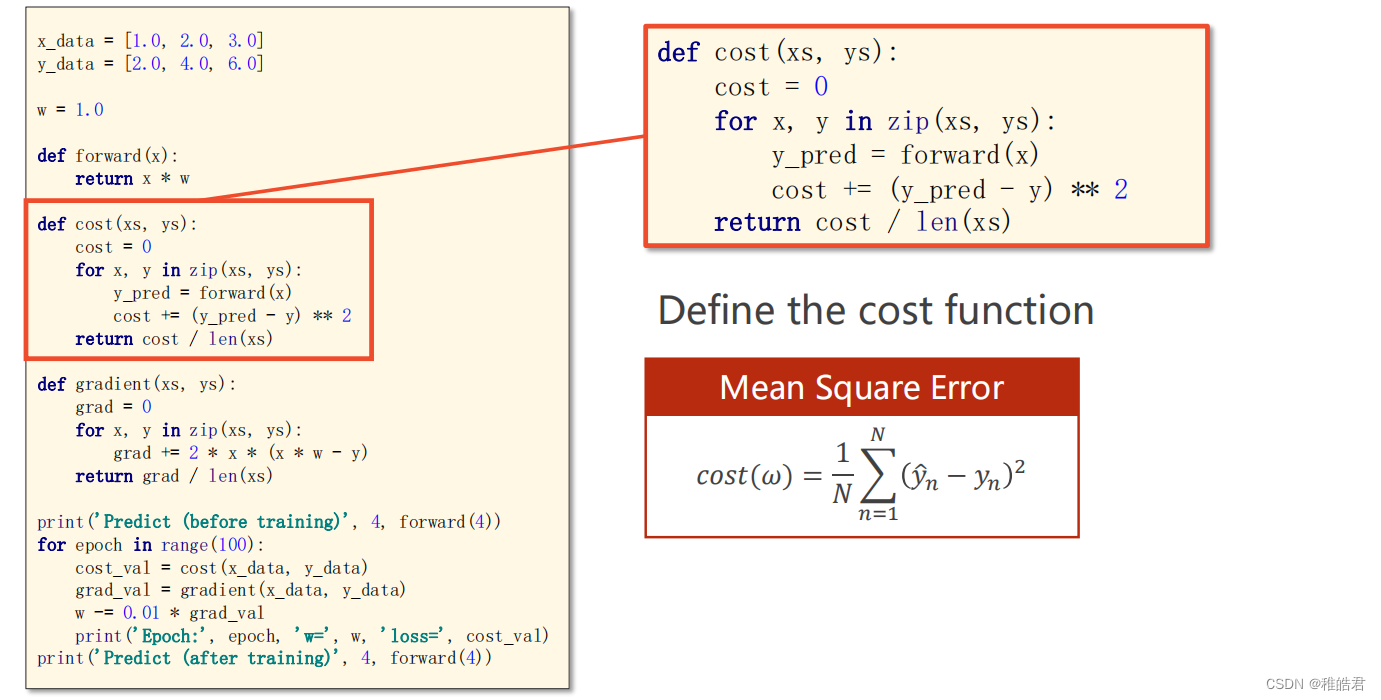
# 计算损失
def cost(xs, ys):
cost = 0
for x, y in zip(xs, ys):
y_pred = forward(x)
cost += (y_pred - y) ** 2
return cost / len(xs)
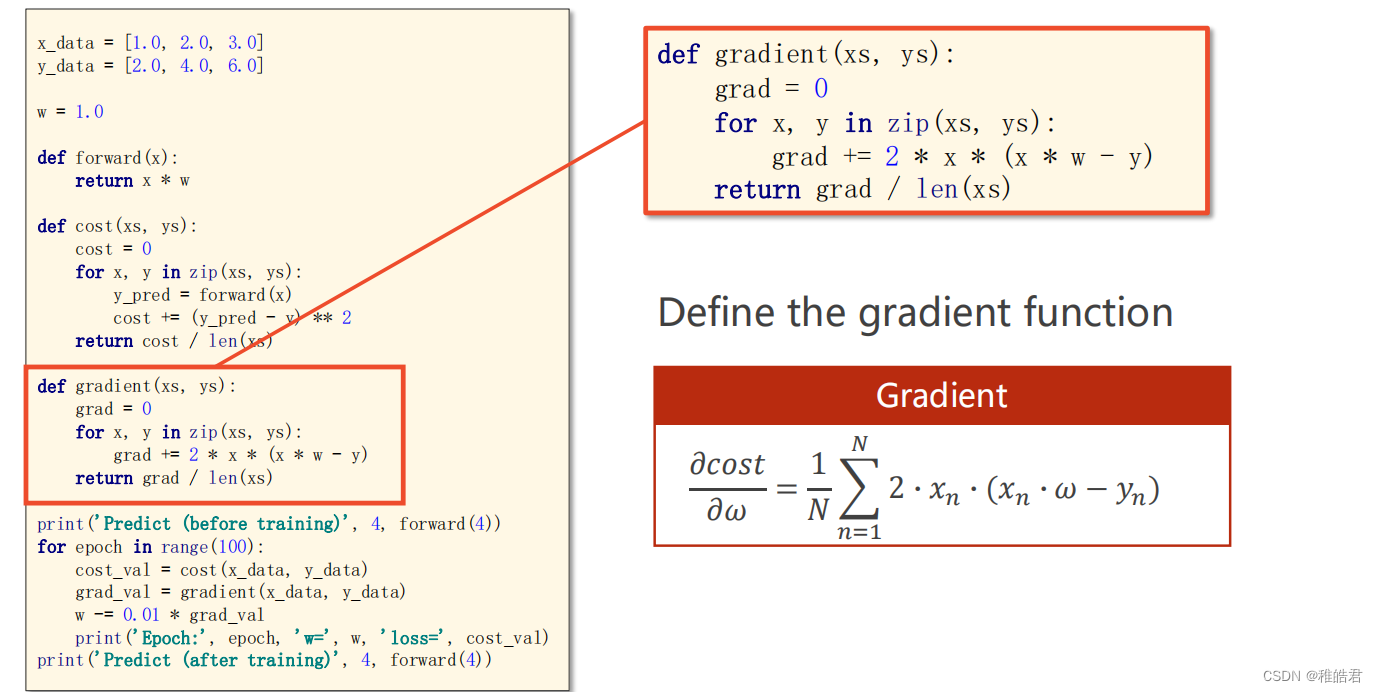
# 计算梯度
def gradien(xs, ys):
grad = 0
for x, y in zip(xs, ys):
grad += 2 * x * (x * w - y)
return grad / len(xs)
print('Predict(before training)', 4, forward(4))
# 存放每轮的数据
cost_list = []
epoch_list = []
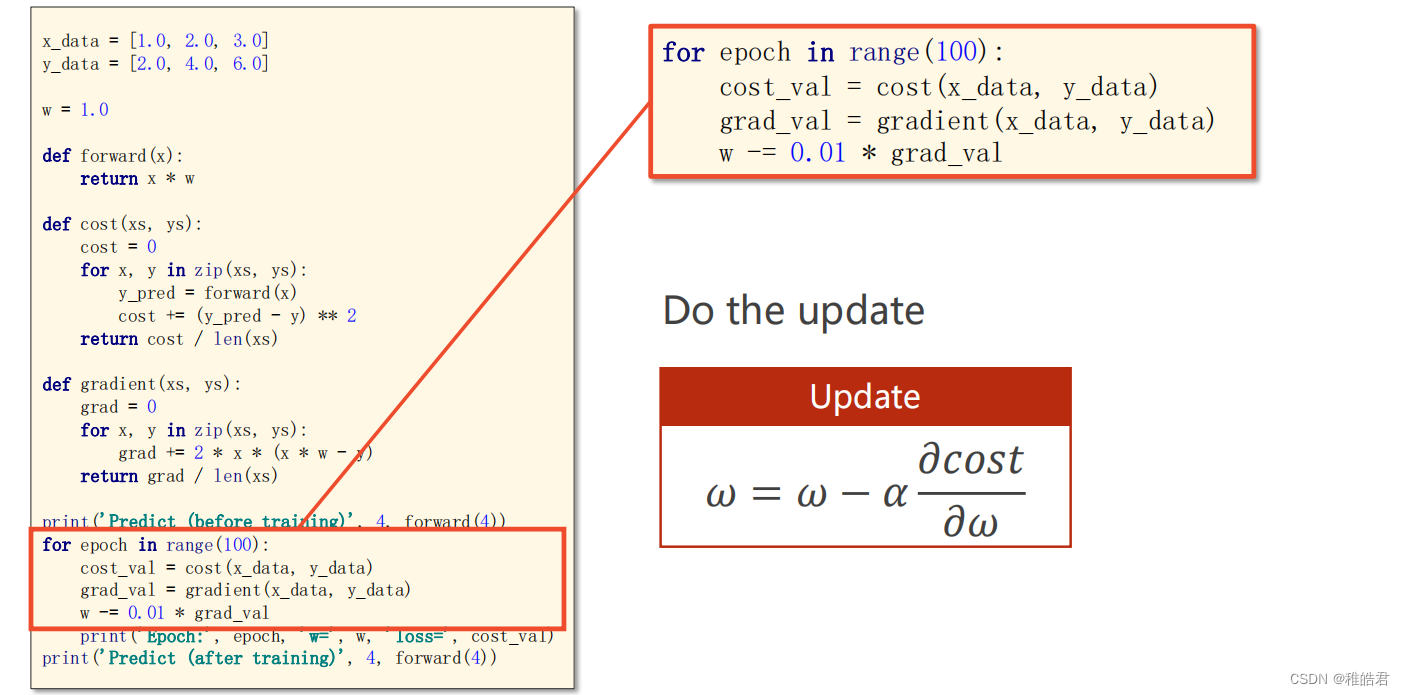
# 训练过程
for epoch in range(100): # 训练100轮
cost_val = cost(x_data, y_data)
grad_val = gradien(x_data, y_data) # 更新梯度
w -= 0.01 * grad_val # 0.01 学习率
print('Epoch:', epoch, 'w = ', w, 'loss = ', cost_val)
cost_list.append(cost_val)
epoch_list.append(epoch)
print('Predict(after training)', 4, forward(4))
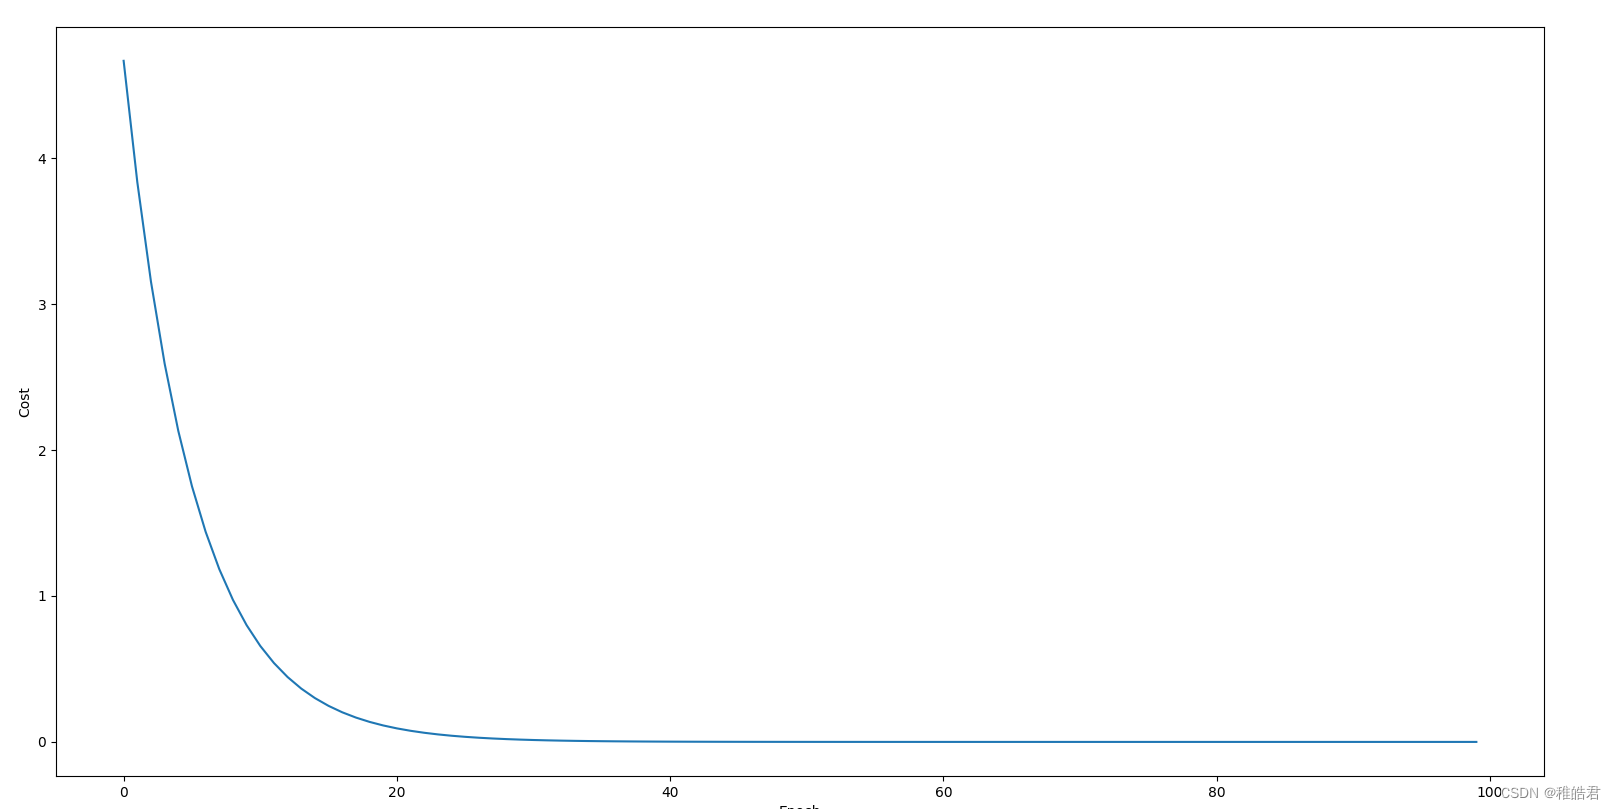
# 绘图展示
plt.plot(epoch_list, cost_list)
plt.xlabel('Epoch')
plt.ylabel('Cost')
plt.show()
实现效果
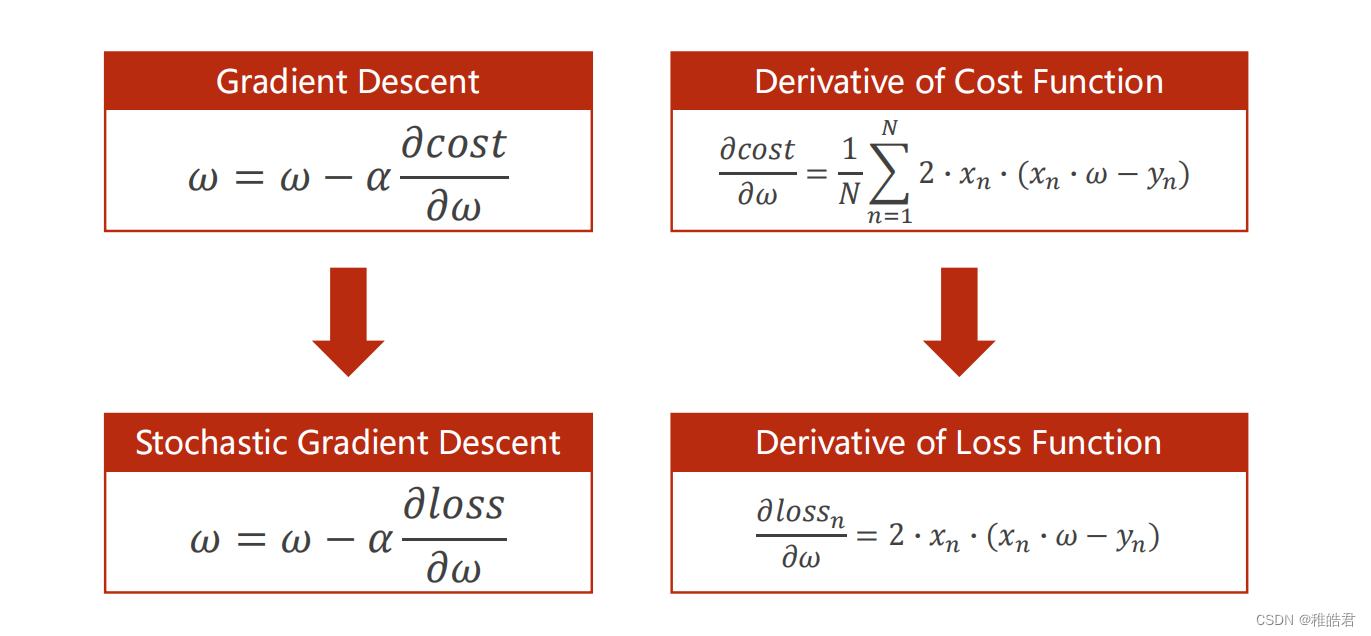
随机梯度下降
使用随机梯度下降对上述问题进行求解,随机梯度下降法和梯度下降法的主要区别在于:
1、损失函数由计算所有训练数据的损失,更改为计算一个训练数据的损失。
2、梯度函数由计算所有训练数据的梯度,更改为计算一个训练数据的梯度。
问题分析
编程实现
代码
import matplotlib.pyplot as plt
# 训练集数据
x_data = [1.0, 2.0, 3.0]
y_data = [2.0, 4.0, 6.0]
# 设置初始权重猜测
w = 1.0
# 前馈计算
def forward(x):
return x * w
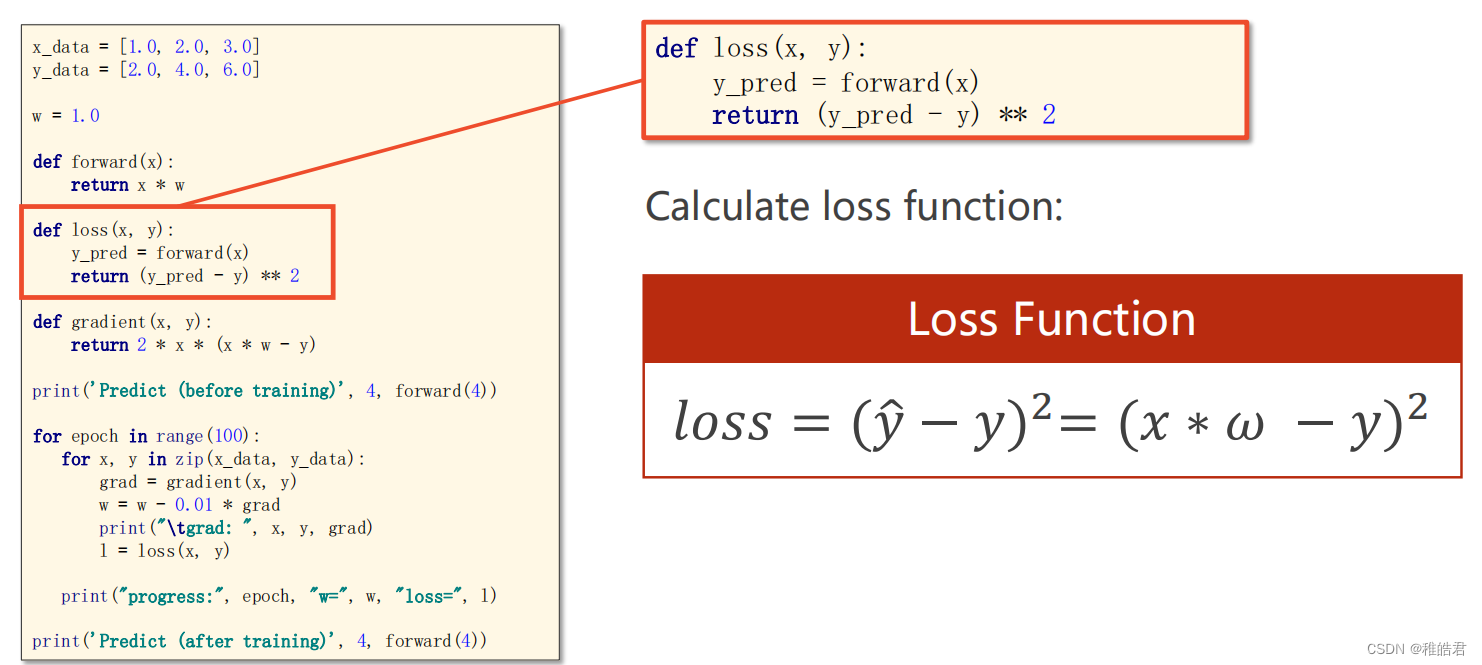
# 计算损失
def loss(x, y):
y_pred = forward(x)
return (y_pred - y) ** 2
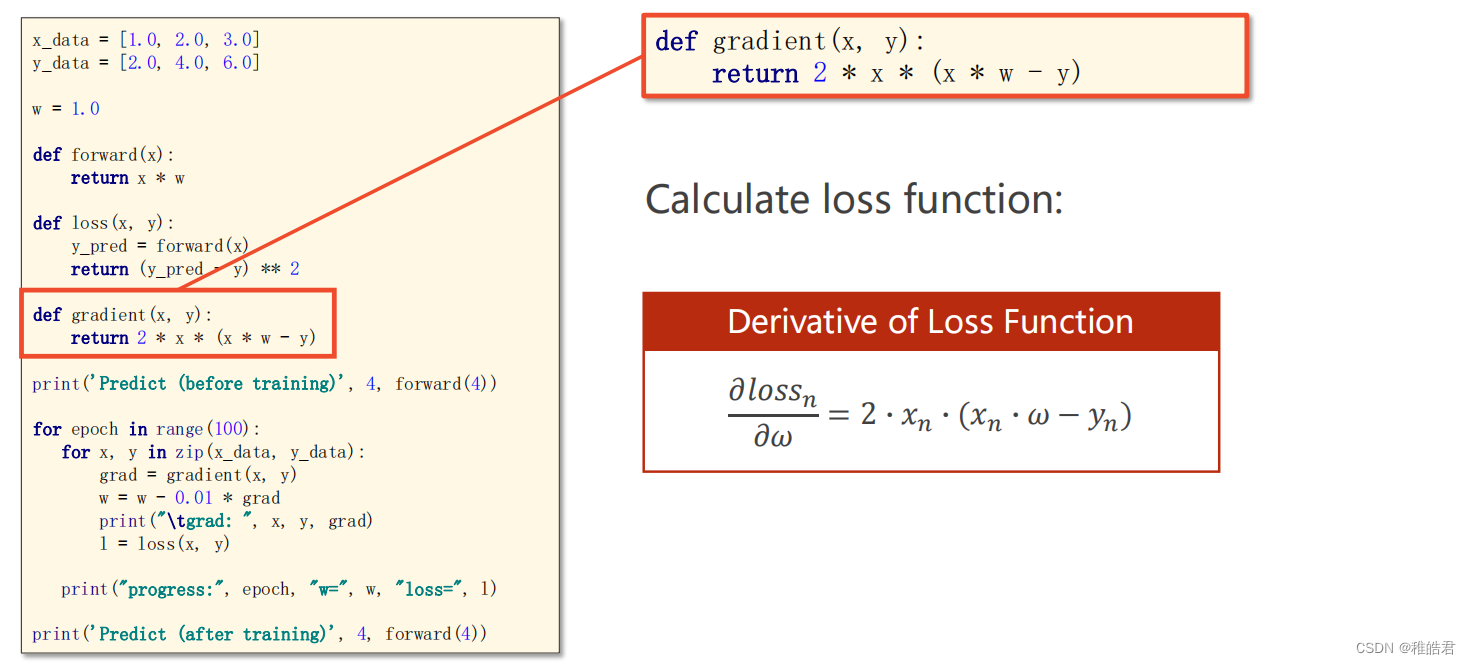
# 计算梯度
def gradien(x, y):
return 2 * x * (x * w - y)
print('Predict(before training)', 4, forward(4))
# 存放每轮的数据
loss_list = []
epoch_list = []
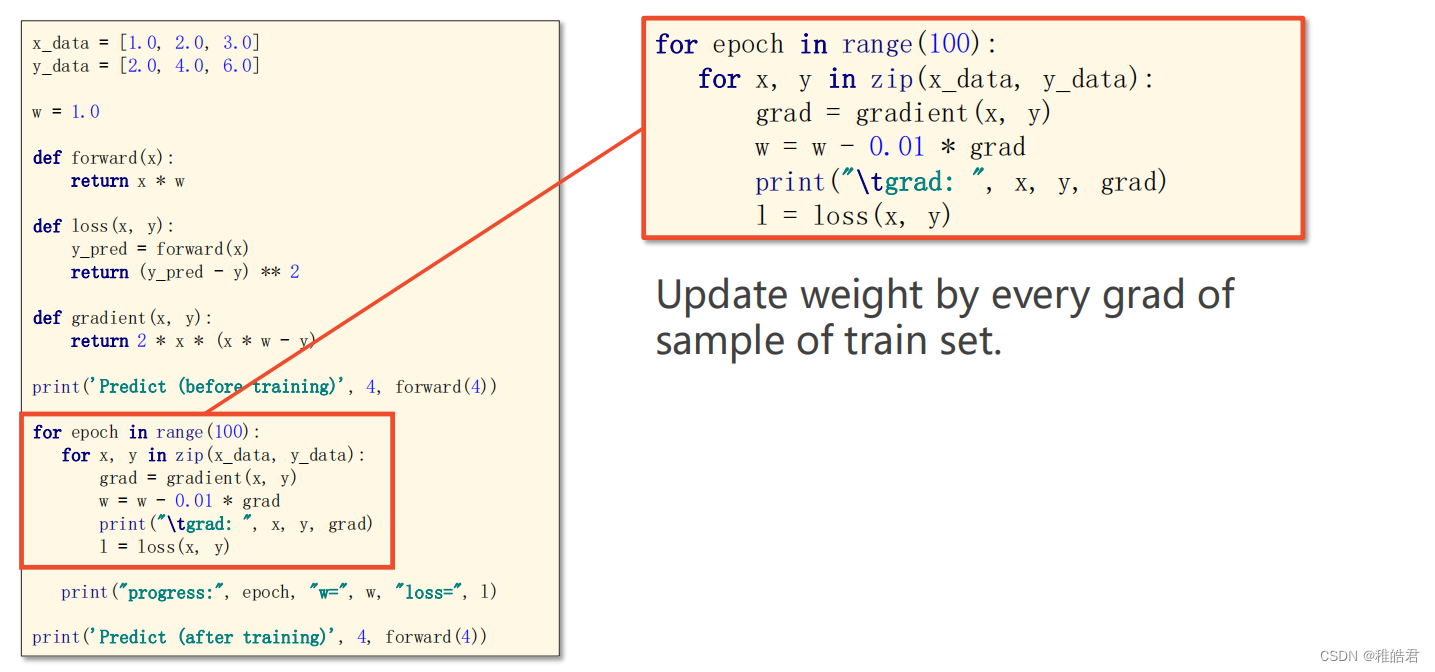
# 训练过程
for epoch in range(100): # 训练100轮
for x, y in zip(x_data, y_data):
grad = gradien(x, y)
w = w - 0.01 * grad
print('\tgrad:', x, y, grad)
l = loss(x, y)
epoch_list.append(epoch)
loss_list.append(l)
print('Predict(after training)', 4, forward(4))
# 绘图展示
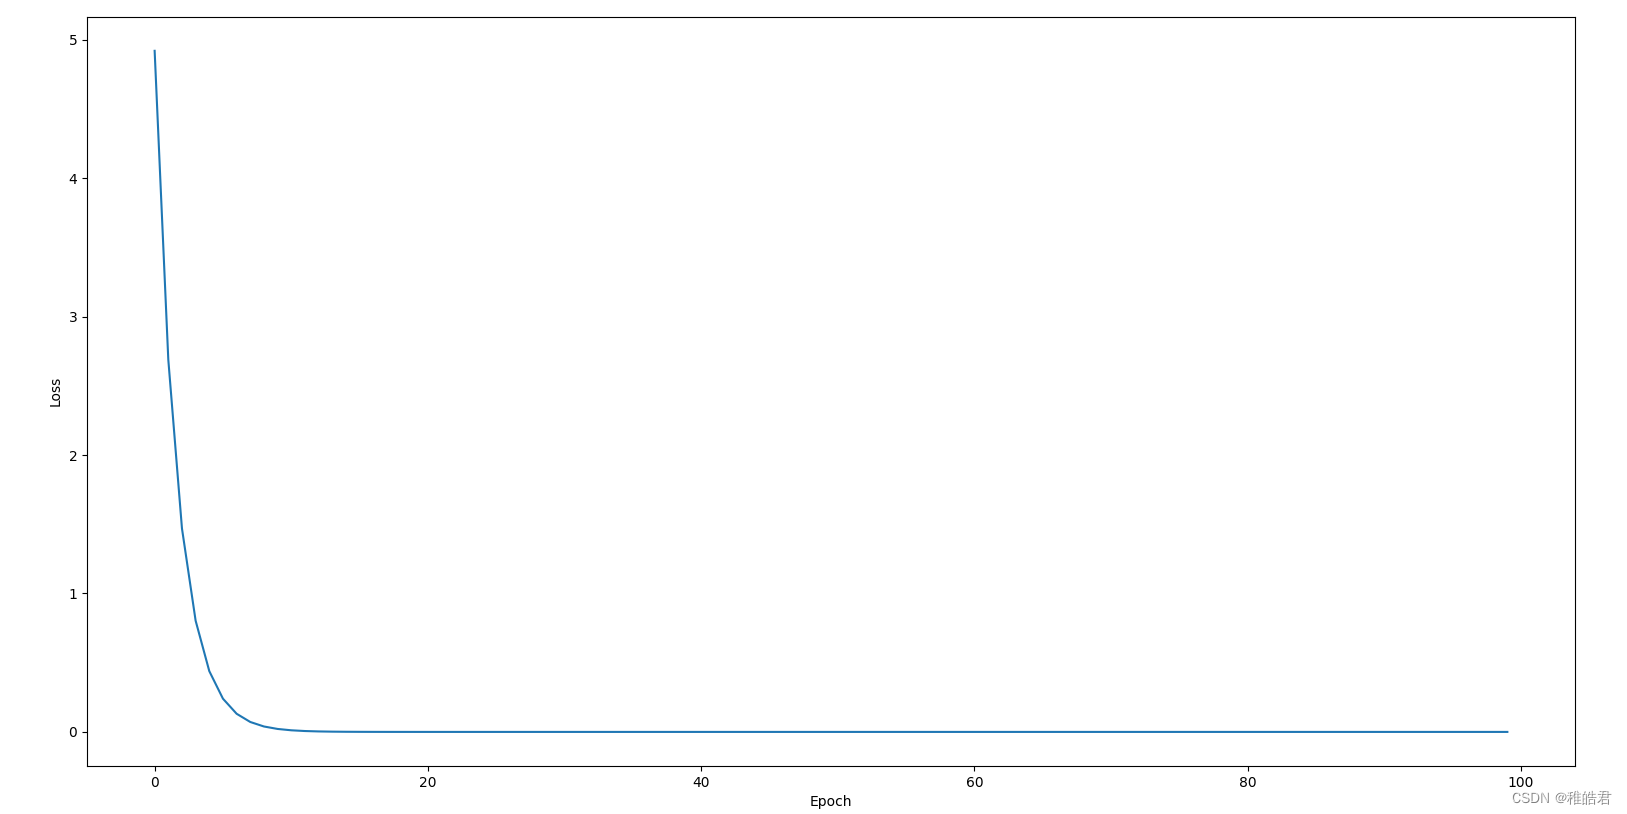
plt.plot(epoch_list, loss_list)
plt.xlabel('Epoch')
plt.ylabel('Loss')
plt.show()
实现效果
参考资料
传送门梯度下降算法


 147
147


 被折叠的 条评论
为什么被折叠?
被折叠的 条评论
为什么被折叠?
 到【灌水乐园】发言


