


声学绘图示例-绘制包络信息
概念
幅值包络Amplitude Envelope
操作:依次寻找每一帧中的幅值最大值,将每一帧中幅值最大值连起来就是幅值包络。
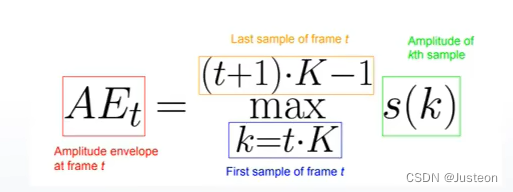
提取第t帧的AE值,其中k是采样点数, t是帧序列数,K每一帧的帧长,采样点k点在{t K ,(t+1) k-1}
应用
振幅包络可以给出响度soundness的大致信息,对突变信号特别敏感(outlier effect)
常应用于:音频检测、音频分类 onset detection/ music genre classification
任务
绘制信号的幅值包络信息
你好! 这是你第一次使用 Markdown编辑器 所展示的欢迎页。如果你想学习如何使用Markdown编辑器, 可以仔细阅读这篇文章,了解一下Markdown的基本语法知识。
1.引入pyplot绘图库
#导入画图库
from matplotlib import pyplot
import librosa.display
#这里将他明明成为了plt方便编辑(行业多数人使用)
from matplotlib import pyplot as plt
2.定义画布
plt.figure(figsize=(20,10))
3.画出原始音频及包络
#先定义坐标尺度
frame_scale=np.arange(0,len(waveform_AE))
time_scale=librosa.frames_to_time(frame_scale,hop_length=frame_size,hop_length=hop_size)
#原始音频
librosa.display.waveshow(waveform)
#包络信号
plt.plot(time_scale,waveform_AE,color="r")
4.展示及效果图
plt.title("Amplitude_Envelope")
plt.show()
print("finissh it!")
全代码如下:
##提取信号幅值包络
#预设环境
import librosa
import numpy as np
from matplotlib import pyplot as plt
import librosa.display
#加载信号
wave_path = r"D:\Code_of_SSL\Chapter1\Dataset_CMUARCTIC\ARCTIC\cmu_us_aew_arctic\wav\arctic_a0001.wav"
waveform,sample_rate = librosa.load(wave_path,sr=None)
#定义一个AE函数,功能为取信号中每一帧幅值为该帧的包络
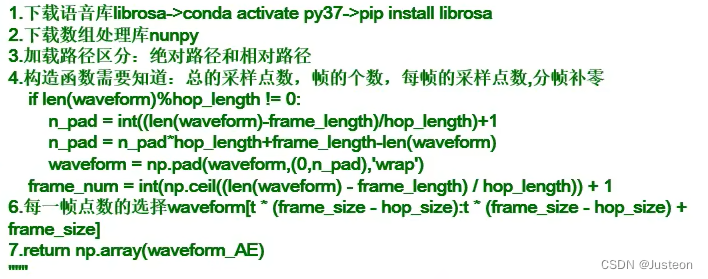
def Calc_Amplitude_Envelope(waveform, frame_length, hop_length):
if len(waveform) % hop_length != 0:
frame_num =int ( (len(waveform) - frame_length) / hop_length ) +1
pad_num = frame_num * hop_length + frame_length - len(waveform)
waveform = np.pad(waveform,(0,pad_num), mode="wrap")
frame_num = int ( (len(waveform) - frame_length) / hop_length ) +1
#遍历每一帧
waveform_ae = []
for t in range(frame_num):
current_frame = waveform[t*(frame_length - hop_length): t * (frame_length - hop_length) + frame_length]
current_ae = max(current_frame)
waveform_ae.append(current_ae)
return np.array(waveform_ae)
#3.设置参数,每一帧长1024,以50%重叠率分帧,调用该函数
frame_size = 1024
hop_size = int(frame_size * 0.5)
waveform_AE = Calc_Amplitude_Envelope(waveform=waveform, frame_length=frame_size,hop_length=hop_size)
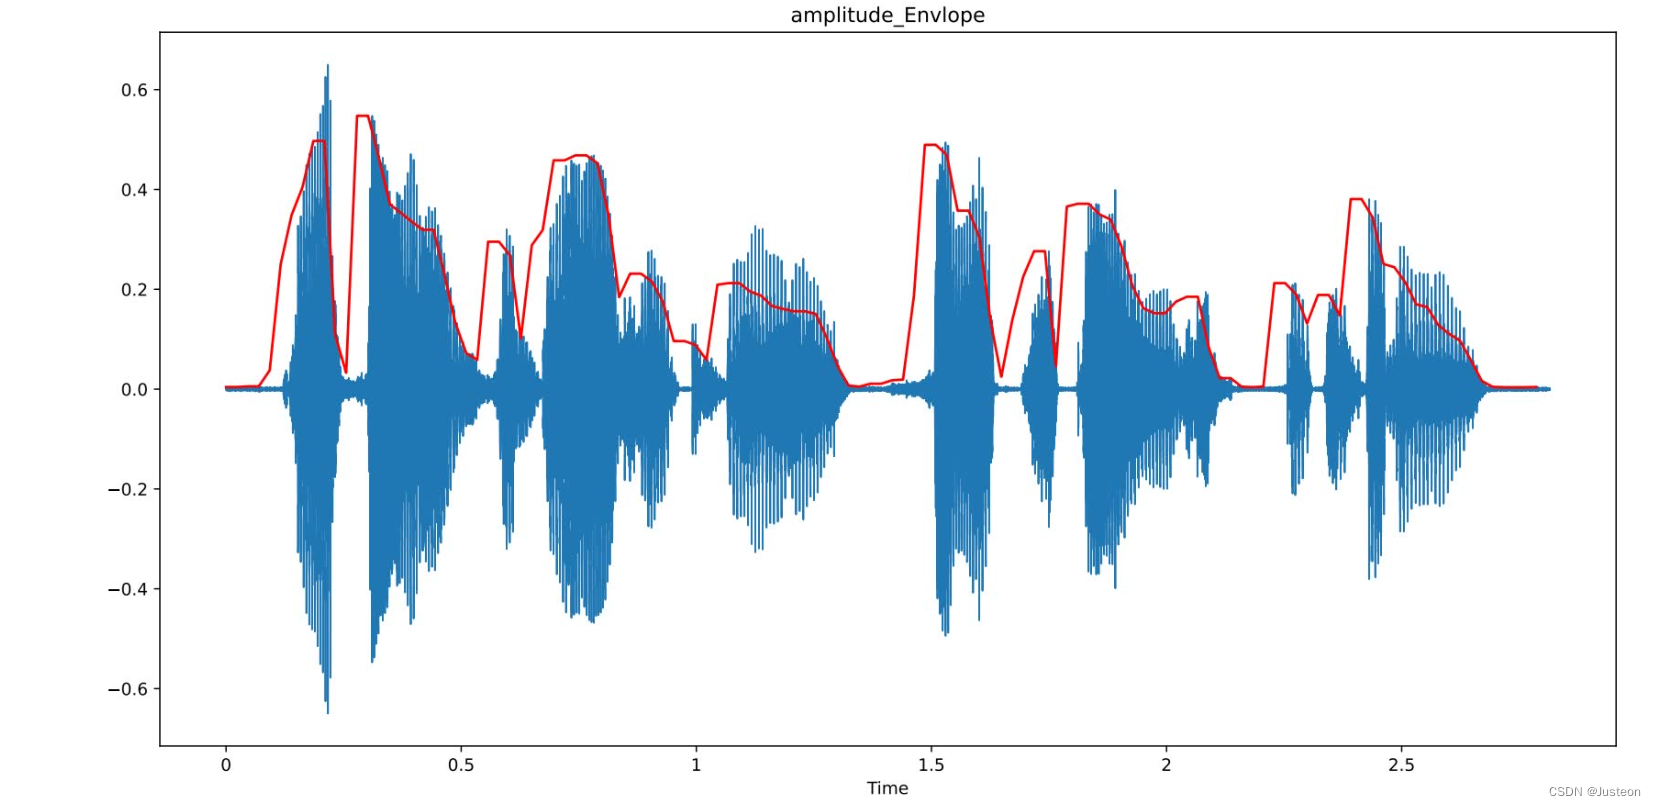
#4.绘制幅值包络信息
frame_scale = np.arange(0, len(waveform_AE))
time_scale = librosa.frames_to_time(frame_scale, hop_length=hop_size)
plt.figure(figsize=(20,10))
librosa.display.waveshow(waveform)
plt.plot(time_scale, waveform_AE,color="r")
plt.title("amplitude_Envlope")
plt.show()
print("Congratulations!!! You finish it !!!")


 3030
3030


 被折叠的 条评论
为什么被折叠?
被折叠的 条评论
为什么被折叠?
 到【灌水乐园】发言


