


记录一下时域图绘制函数。
直接plt.plot()绘制是方便,但是缺少横纵坐标标签,横纵坐标刻度。为此写了一个函数,方便后续直接拿来使用。
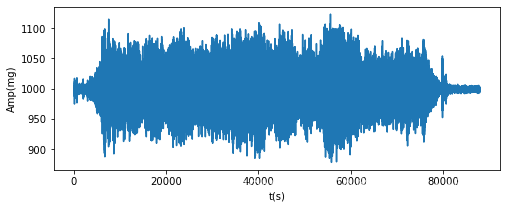
plt.plot(arr)
plt.xlabel('t(s)')
plt.ylabel('Amp(mg)')
plt.show()
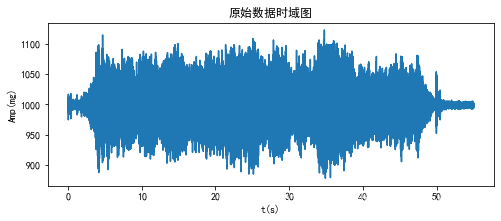
定义时域图绘制函数
def plt_time_domain(arr, fs=1600, xlabel='t(s)', ylabel='Amp(mg)', title='原始数据时域图', img_save_path=None):
    """
    :fun: 绘制时域图模板
    :param arr: 输入一维数组数据
    :param fs: 采样频率
    :param ylabel: y轴标签
    :param title: 图标题
    :return: None
    """
    import matplotlib.pyplot as plt
    plt.rcParams['font.sans-serif'] = ['SimHei']  # 显示中文
    plt.rcParams['axes.unicode_minus'] = False  # 显示负号
    font = {'family': 'Times New Roman', 'size': '20', 'color': '0.5', 'weight': 'bold'}

    plt.figure(figsize=(8,3))
    length = len(arr)
    t = np.arange(0, length/fs, 1/fs)
    plt.plot(t, arr)
    plt.xlabel(xlabel)
    plt.ylabel(ylabel)
    plt.title(title)
    #===保存图片====#
    if img_save_path:
        plt.savefig(img_save_path, dpi=500, bbox_inches = 'tight')
    plt.show()
plt_time_domain(arr)
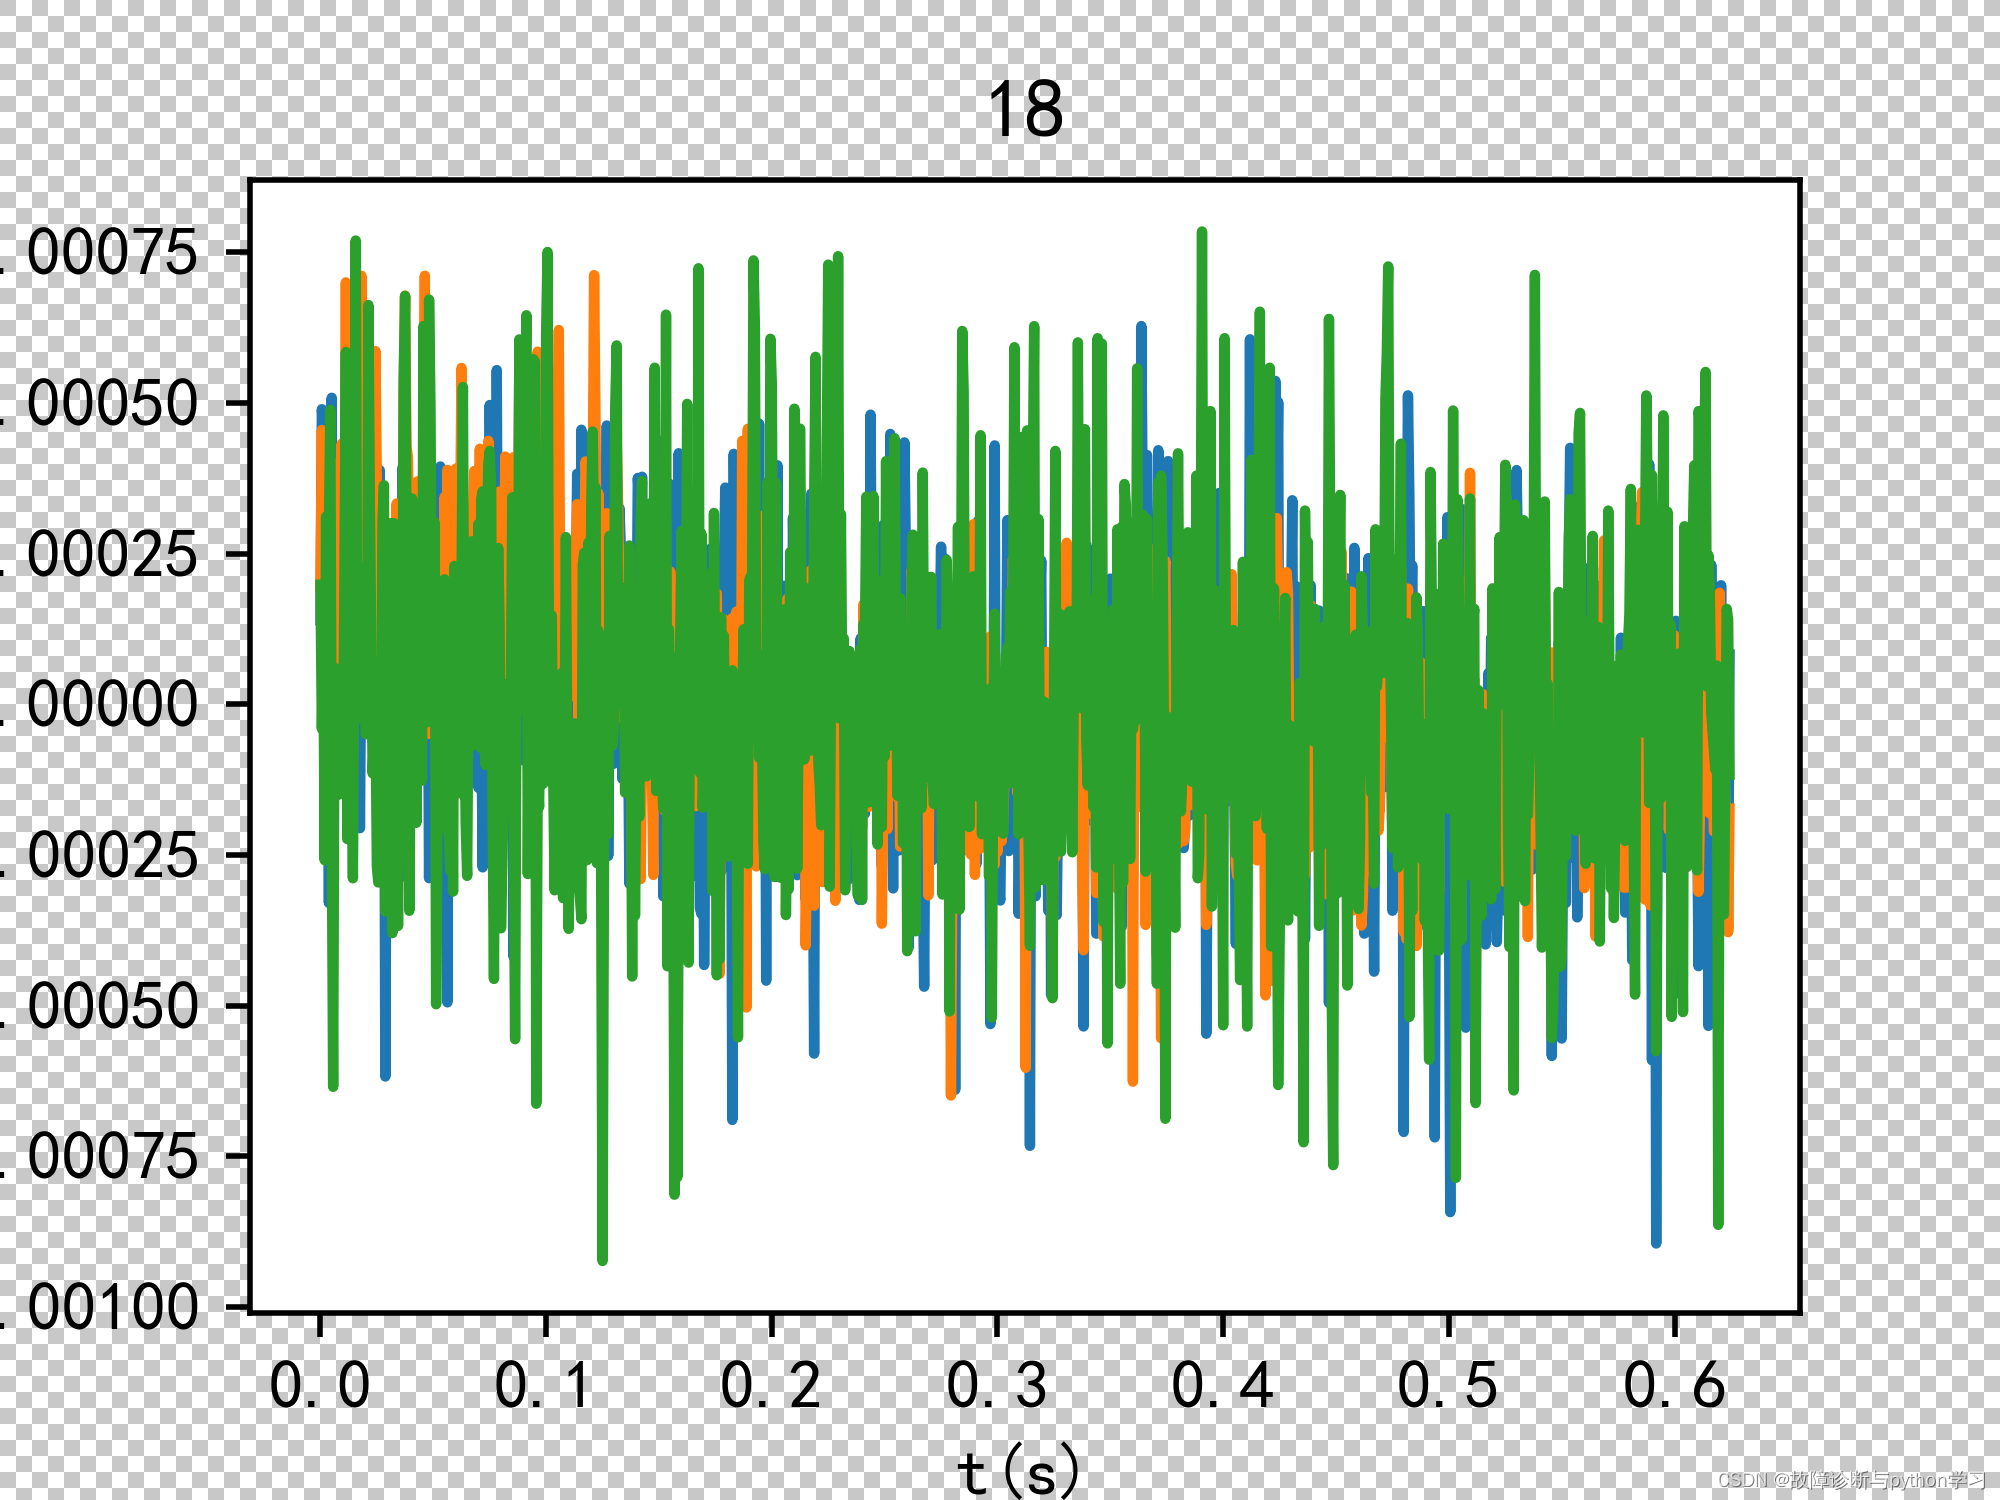
未加bbox_inches = 'tight'之前,保存的图片不完整
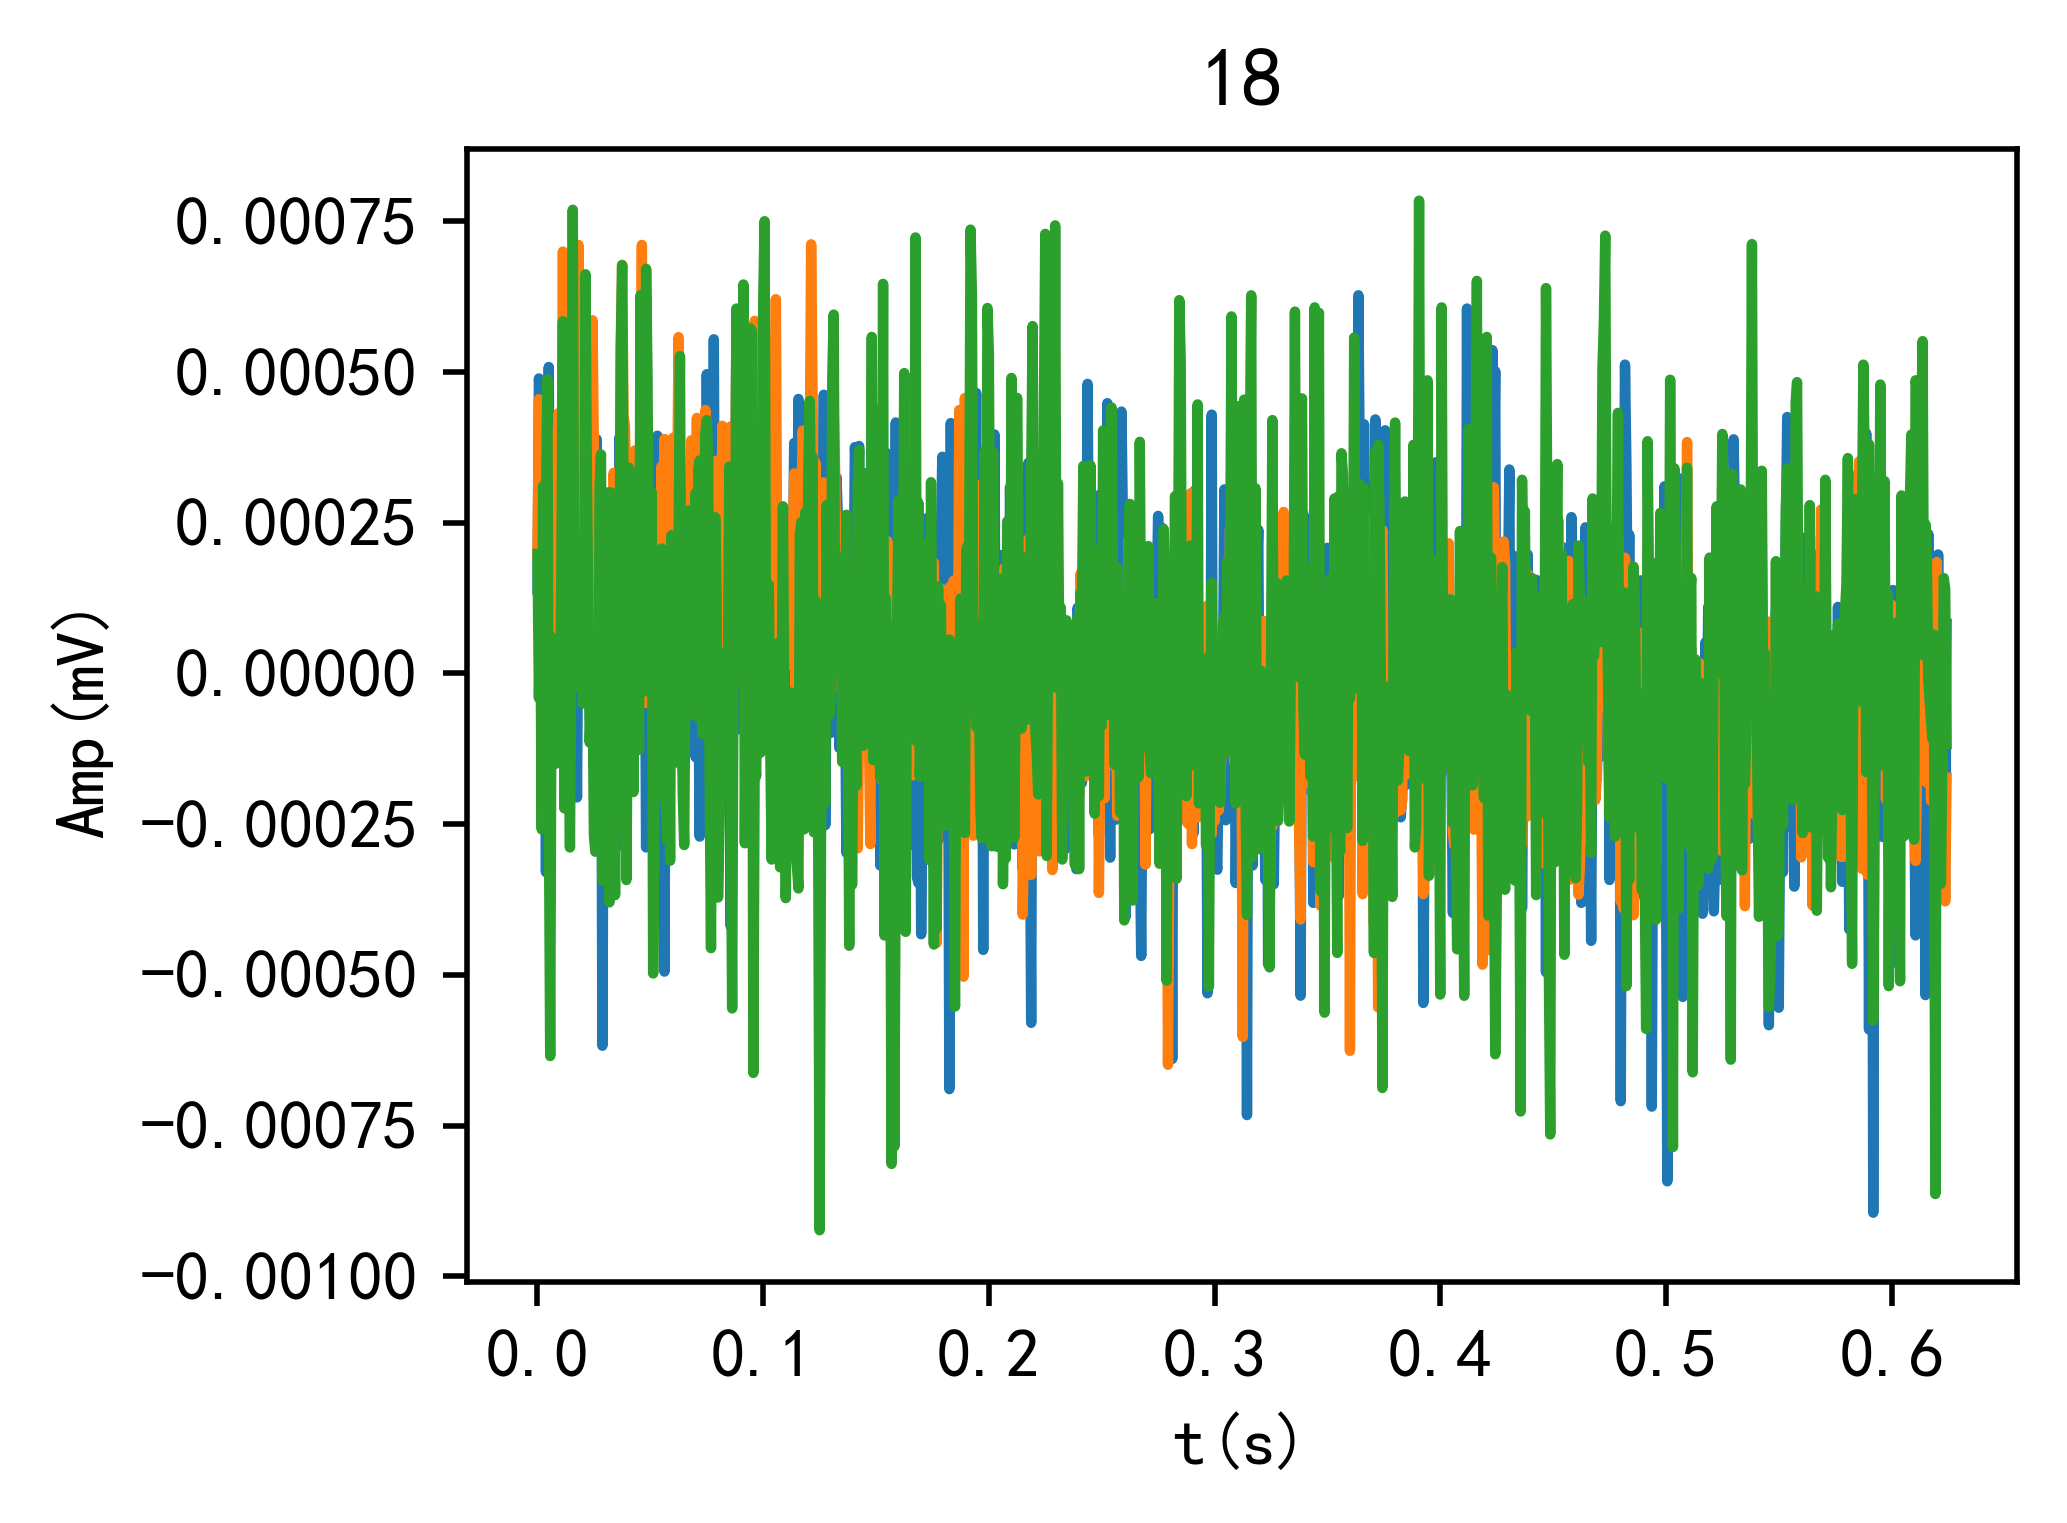
加了bbox_inches = 'tight'之后,保存的图片完整。


 2256
2256


 被折叠的 条评论
为什么被折叠?
被折叠的 条评论
为什么被折叠?
 到【灌水乐园】发言


