


全局安装echarts依赖
npm install echarts --save
然后在main.js中全局引入
import echarts from 'echarts'
Vue.prototype.$echarts = echarts;
在绘制图表时,需要给定一个容器div,给容器设定宽度和高度,这样打开页面时,就不至于图表显示不出来
 <div class="charts">
      <div id="charts04"></div>
 </div>
css样式
#charts04 {
  width: 100%;
  height: 360px;
}
逻辑部分的代码
在这个部分需要初始化这个容器,最后调用setOption这个方法,折线图的基本配置内容如下所示
let myChart = this.$echarts.init(document.getElementById('charts04'));
let option = {
        title: {
          text: '',
          textStyle: {
            color: '#1a1a1a',
            fontSize: 14,
          }
        },
        tooltip: {
          trigger: 'axis',
        },
        grid: {
          left: '5%',
          top: '20%',
          bottom: '3%',
          containLabel: true
        },
        color: ['rgb(224,59,59)', 'rgb(247,169,65)', 'rgb(30,84,213)', 'rgb(103,198,113)', 'rgb(132,0,255)'],
        legend: {
          x: '20px',
          y: '30px',
          itemGap: 12,
          orient: 'horizontal',
          itemHeight: 10,
          itemWidth: 10,
          data: [{icon: 'rect', name: 'P50'}, {icon: 'rect', name: 'P75'},
            {icon: 'rect', name: 'P90'}, {icon: 'rect', name: 'P95'}, {icon: 'rect', name: 'P99'}
          ]
        },
        xAxis: [
          {
            type: 'category',
            boundaryGap: false,
            data: dateList,
            axisTick: {//刻度相关设置
              show: false//让刻度隐藏
            },
          }
        ],
        yAxis: [
          {
            type: 'value',
            axisLine: {
              show: false,    // 是否显示坐标轴轴线
            },
            axisTick: {//刻度相关设置
              show: false//让刻度隐藏
            },
          }
        ],
        series: [
          {
            name: 'P50',
            type: 'line',
            smooth: true,
            symbol: 'none',
            stack: 'Total',
            lineStyle: {
              color: 'rgb(224,59,59)'
            },
            data: itemsP50
          },
          {
            name: 'P75',
            type: 'line',
            smooth: true,
            symbol: 'none',
            stack: 'Total',
            lineStyle: {
              color: 'rgb(247,169,65)'
            },
            data: itemsP75
          },
          {
            name: 'P90',
            type: 'line',
            smooth: true,
            symbol: 'none',
            stack: 'Total',
            lineStyle: {
              color: 'rgb(30,84,213)'
            },
            data: itemsP90
          },
          {
            name: 'P95',
            type: 'line',
            smooth: true,
            stack: 'Total',
            symbol: 'none',
            lineStyle: {
              color: 'rgb(103,198,113)'
            },
            data: itemsP95
          },
          {
            name: 'P99',
            type: 'line',
            smooth: true,
            stack: 'Total',
            symbol: 'none',
            lineStyle: {
              color: 'rgb(132,0,255)'
            },
            data: itemsP99
          }
        ]
      };
      myChart.setOption(option);
页面完整代码如下所示
<template>
  <el-card>
    <div class="charts">
      <div id="charts04"></div>
    </div>
  </el-card>
</template>

<script>
import monitor from "../../../api/monitor";
import {intervalTime} from '@/views/pages/system/service/dealTimeSw'
import {countDateFn} from '@/views/utils/editTime'
export default {
  props: ["datetime"],
  name: "accessPercentile",
  methods: {
    async accessPercentile(start, end) {
      let {step, startDate, endDate} = countDateFn(start, end);
      let name=''
      if(this.$route.params.scope!=undefined){
         name = this.$route.params.scope.name;
      }else{
         name =localStorage.getItem('name')
      }
      let params = {
        end: endDate,
        start: startDate,
        step: step,
      }
      let dateNow = {
        step: step,
        millisecondStart: new Date(start).getTime(),
        millisecondEnd: new Date(end).getTime()
      };
      let dateList = intervalTime(dateNow);
      let data = []
      await monitor.queryDatabaseAccessPercentile(name, params).then(res => {
        if (res.data && res.status === 200) {
          data = res.data;
        } else {
          this.$popError(res.data.message);
        }
        this.initResponseTimeChart(dateList, data);
      })
    },
    // 延迟时间
    initResponseTimeChart(dateList, items) {
      let myChart = this.$echarts.init(document.getElementById('charts04'));
      let itemsP50 = [], itemsP75 = [], itemsP90 = [], itemsP95 = [], itemsP99 = [];
      if (items[0].values && items[0].values.values.length > 0) {
        itemsP50 = items[0].values.values.map(r => r.value);
      }
      if (items[1].values && items[1].values.values.length > 0) {
        itemsP75 = items[1].values.values.map(r => r.value);
      }
      if (items[2].values && items[2].values.values.length > 0) {
        itemsP90 = items[2].values.values.map(r => r.value);
      }
      if (items[3].values && items[3].values.values.length > 0) {
        itemsP95 = items[3].values.values.map(r => r.value);
      }
      if (items[4].values && items[4].values.values.length > 0) {
        itemsP99 = items[4].values.values.map(r => r.value);
      }
      let option = {
        title: {
          text: '',
          textStyle: {
            color: '#1a1a1a',
            fontSize: 14,
          }
        },
        tooltip: {
          trigger: 'axis',
        },
        grid: {
          left: '5%',
          top: '20%',
          bottom: '3%',
          containLabel: true
        },
        color: ['rgb(224,59,59)', 'rgb(247,169,65)', 'rgb(30,84,213)', 'rgb(103,198,113)', 'rgb(132,0,255)'],
        legend: {
          x: '20px',
          y: '30px',
          itemGap: 12,
          orient: 'horizontal',
          itemHeight: 10,
          itemWidth: 10,
          data: [{icon: 'rect', name: 'P50'}, {icon: 'rect', name: 'P75'},
            {icon: 'rect', name: 'P90'}, {icon: 'rect', name: 'P95'}, {icon: 'rect', name: 'P99'}
          ]
        },
        xAxis: [
          {
            type: 'category',
            boundaryGap: false,
            data: dateList,
            axisTick: {//刻度相关设置
              show: false//让刻度隐藏
            },
          }
        ],
        yAxis: [
          {
            type: 'value',
            axisLine: {
              show: false,    // 是否显示坐标轴轴线
            },
            axisTick: {//刻度相关设置
              show: false//让刻度隐藏
            },
          }
        ],
        series: [
          {
            name: 'P50',
            type: 'line',
            smooth: true,
            symbol: 'none',
            stack: 'Total',
            lineStyle: {
              color: 'rgb(224,59,59)'
            },
            data: itemsP50
          },
          {
            name: 'P75',
            type: 'line',
            smooth: true,
            symbol: 'none',
            stack: 'Total',
            lineStyle: {
              color: 'rgb(247,169,65)'
            },
            data: itemsP75
          },
          {
            name: 'P90',
            type: 'line',
            smooth: true,
            symbol: 'none',
            stack: 'Total',
            lineStyle: {
              color: 'rgb(30,84,213)'
            },
            data: itemsP90
          },
          {
            name: 'P95',
            type: 'line',
            smooth: true,
            stack: 'Total',
            symbol: 'none',
            lineStyle: {
              color: 'rgb(103,198,113)'
            },
            data: itemsP95
          },
          {
            name: 'P99',
            type: 'line',
            smooth: true,
            stack: 'Total',
            symbol: 'none',
            lineStyle: {
              color: 'rgb(132,0,255)'
            },
            data: itemsP99
          }
        ]
      };
      myChart.setOption(option);
    },
  },
  watch: {
    datetime() {
        const {startTime, endTime} = this.datetime;
        this.accessPercentile(startTime, endTime)
    }
  }
}
</script>

<style scoped>
#charts04 {
  width: 100%;
  height: 360px;
}

</style>
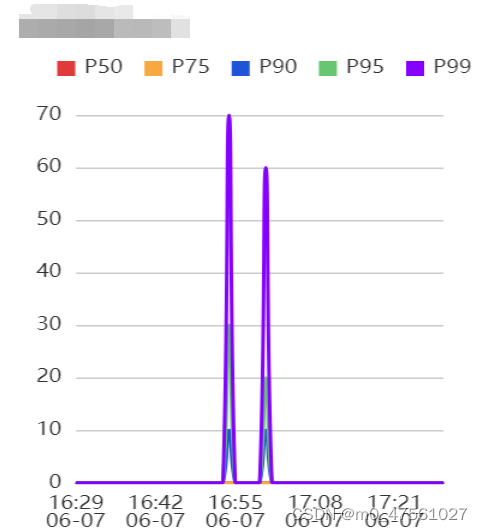
页面具体展示效果如下所示


 1686
1686


 被折叠的 条评论
为什么被折叠?
被折叠的 条评论
为什么被折叠?
 到【灌水乐园】发言


