


from mpl_toolkits.mplot3d import axes3d
import matplotlib.pyplot as plt
# 打开画图窗口1,在三维空间中绘图
fig = plt.figure(1)
ax = fig.gca(projection='3d')
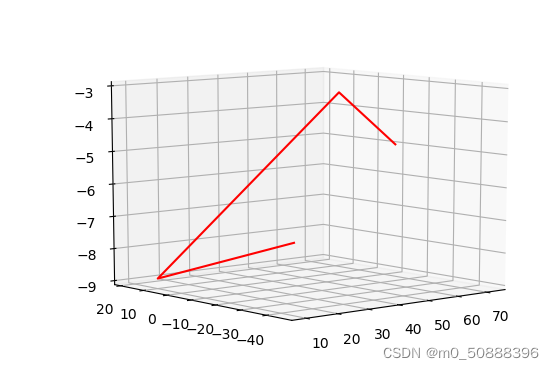
# 给出点(0,0,0)和(100,200,300)
x = [
72, 37, 16, 10]
y = [
-12, -30, 18, -45]
z = [
-5, -3, -9, -7]
# 将数组中的前两个点进行连线
figure = ax.plot(x, y, z, c='r')
plt.show()


 5764
5764

 被折叠的 条评论
为什么被折叠?
被折叠的 条评论
为什么被折叠?
 到【灌水乐园】发言


