


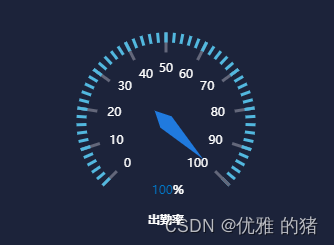
示例1
<doc>
仪表盘组件
</doc>
<template style="height: 100%;width: 100%;">
<div id="gauge" style="width: 100%; height: 100%"></div>
</template>
<script>
import { fontChart } from '@/utils/echartPxToRem'
import * as echarts from 'echarts'
export default {
data() {
return {
charts: "",
};
},
mounted() {
this.drawGauge();
},
props: {
value: {
type: String,
default: '100'
}
},
destroyed() {
window.removeEventListener("resize", this.selfAdaption);
},
methods: {
drawGauge() {
this.charts = echarts.init(document.getElementById("gauge"));
let option = {
tooltip: {
trigger: "item",
formatter: "{a} <br/>{b}: {c} (%)",
},
series: [
{
type: "gauge",
// 控制表盘大小
radius: "85%",
startAngle: fontChart(225), //开始角度
// endAngle: -20, //结束角度
axisLine: {
// 控制表格展开范围
show: false,
lineStyle: {
width: fontChart(5),
opacity: 0,
},
},
title: { show: false },
// 当前展示数值
detail: { // 仪表盘详情,用于显示数据。
show: true, // 是否显示详情,默认 true。
offsetCenter: [0,"80%"],// 相对于仪表盘中心的偏移位置,数组第一项是水平方向的偏移,第二项是垂直方向的偏移。可以是绝对的数值,也可以是相对于仪表盘半径的百分比。
color: '#fff',
fontWeight: '700',
fontSize: '12',
formatter: "{a| " + this.value +"}%\n出勤率", // 格式化函数或者字符串
rich: {
a: {
color: '#007acc'
}
}
},
// 整数刻度指示
splitLine: {
show: true,
length: 20,
},
axisTick: {
// 刻度格到中心的长度
length: fontChart(10),
// 刻度格之间的距离
splitNumber: fontChart(5),
lineStyle: {
// 刻度颜色
color: "#52B8DF",
// 刻度宽度
width: fontChart(3),
},
},
// 刻度数值显示
axisLabel: {
show: true,
distance: 15,
textStyle: {
color: '#fff'
}
},
// 表针显示
pointer: {
show: true,
length: '50%',
width: fontChart(8),
// offsetCenter: [0, '-55%'],
itemStyle:{
color:"#207ade",
// opacity: 0.7
},
},
data: [
{
value: parseFloat(this.value),
name: "出勤率",
nameTextStyle: {
fontSize: fontChart(13),
},
itemStyle: {
color: "#1990fd",
},
},
],
},
],
};
this.charts.setOption(option, true);
window.addEventListener("resize", this.selfAdaption);
},
// 自适应
selfAdaption() {
if(!this.charts) return
this.charts.resize();
this.drawGauge()
}
}
}
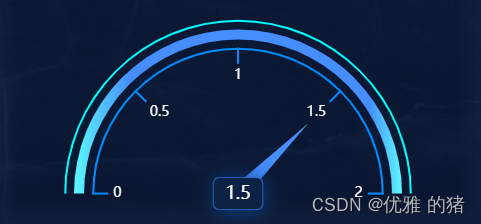
</script>示例2
<template>
<div :id="id" style="width: 100%; height: 100%"></div>
</template>
<script>
import * as echarts from "echarts";
import { fontChart } from "@/utils/echartPxToRem";
export default {
data() {
return {
charts: "",
};
},
props: {
id: {
type: String,
required: true,
},
min: {
type: String,
default: '0'
},
max: {
type: String,
default: '2'
},
gaugeData: {
type: Array,
default: () => [
{
name: "PUE",
value: 1.5,
},
]
},
splitNumber: {
type: String,
default: '4'
}
},
watch: {
gaugeData() {
this.drawGauge()
}
},
mounted() {
this.drawGauge();
},
destroyed() {
window.removeEventListener("resize", this.selfAdaption);
},
methods: {
drawGauge() {
// 基于准备好的dom,初始化echarts实例
this.charts = echarts.init(document.getElementById(this.id));
const color = new echarts.graphic.LinearGradient(0, 0, 1, 0, [
{
offset: 0,
color: "#5CF9FE", // 0% 处的颜色
},
{
offset: 0.17,
color: "#468EFD", // 100% 处的颜色
},
{
offset: 0.9,
color: "#468EFD", // 100% 处的颜色
},
{
offset: 1,
color: "#5CF9FE", // 100% 处的颜色
},
]);
const colorSet = [
[1, color],
// [0.91, color],
// [1, '#FFF']
];
// 指定图表的配置项和数据
let option = {
// backgroundColor: "black",
tooltip: {
show: false,
formatter: "{a} <br/>{b} : {c}%",
},
series: [
{
type: "gauge",
name: "外层辅助",
radius: "143%",
startAngle: "180",
endAngle: "0",
// splitNumber: "120",
pointer: {
show: false,
},
center: ["50%", "85%"], //整体的位置设置
detail: {
show: false,
},
data: [
{
value: 1,
},
],
// data: [{value: 1, name: 90}],
title: {
show: false,
offsetCenter: [0, 30],
textStyle: {
color: "#fff",
fontStyle: "normal",
fontWeight: "normal",
fontFamily: "微软雅黑",
fontSize: fontChart(20),
},
},
axisLine: {
show: true,
lineStyle: {
color: [[1, "#00FFFF"]],
width: fontChart(2),
opacity: 1,
},
},
axisTick: {
show: false,
},
splitLine: {
show: true,
length: fontChart(20),
lineStyle: {
color: "#051932",
width: 0,
type: "solid",
},
},
axisLabel: {
show: false,
// formatter: function (v) {
// return v.toFixed(0);
// },
},
},
{
type: "gauge",
radius: "135%",
startAngle: "180",
endAngle: "0",
pointer: {
show: true,
length: '60%',
width: fontChart(8),
// offsetCenter: [0, '-55%'],
itemStyle:{
color:"#207ade",
// opacity: 0.7
},
},
min: parseFloat(this.min),
max: parseFloat(this.max),
splitNumber: parseFloat(this.splitNumber),
center: ["50%", "85%"], //整体的位置设置
detail: {
offsetCenter: [0, '0'], // x, y,单位px 偏移位置
textStyle: { // 其余属性默认使用全局文本样式,详见TEXTSTYLE
color: '#ffffff',
fontSize: fontChart(18),
borderColor: '#3982f7', // 值域边框颜色
//边框颜色
borderWidth: 0.6,
shadowColor:"#0c4083",//阴影颜色
shadowOffsetX: 2,//阴影水平方向上的偏移距离
shadowOffsetY: 2,//阴影垂直方向上的偏移距离
shadowBlur: fontChart(20),
borderRadius: fontChart(6),
padding: [8,12,6,12]
},
backgroundColor: '#0c2144',
formatter: function(value) {
return value
}
},
data: this.gaugeData,
title: {
show: false,
},
axisLine: {
show: true,
lineStyle: {
color: colorSet,
width: fontChart(10),
// shadowBlur: 15,
// shadowColor: '#B0C4DE',
shadowOffsetX: 0,
shadowOffsetY: 0,
opacity: 1,
},
},
axisTick: {
show: false,
},
splitLine: {
show: false,
length: fontChart(25),
lineStyle: {
color: "#00377a",
width: 2,
type: "solid",
},
},
axisLabel: {
show: false,
// formatter: function (v) {
// return v.toFixed(0);
// },
},
animationDuration: 4000,
},
{
name: "灰色内圈", //刻度背景
type: "gauge",
z: 2,
radius: "120%",
startAngle: "180",
endAngle: "0",
center: ["50%", "85%"], //整体的位置设置
axisLine: {
// 坐标轴线
lineStyle: {
// 属性lineStyle控制线条样式
color: [[1, "#018DFF"]],
fontSize: fontChart(20),
width: 2,
opacity: 1, //刻度背景宽度
},
},
splitLine: {
show: false,
},
axisLabel: {
show: false,
formatter: function (v) {
return v.toFixed(0);
},
},
pointer: {
show: false,
},
axisTick: {
show: false,
},
detail: {
show: 0,
},
},
{
name: "白色圈刻度",
type: "gauge",
radius: "120%",
startAngle: 180, //刻度起始
endAngle: 0, //刻度结束
min: parseFloat(this.min),
max: parseFloat(this.max),
splitNumber: parseFloat(this.splitNumber),
z: 4,
axisTick: {
show: false,
},
center: ["50%", "85%"], //整体的位置设置
splitLine: {
length: fontChart(16), //刻度节点线长度
lineStyle: {
width: 2,
color: "#018DFF",
}, //刻度节点线
},
axisLabel: {
color: "rgba(255,255,255,8)",
fontSize: fontChart(14),
// formatter: function (v) {
// return v.toFixed(0);
// },
}, //刻度节点文字颜色
pointer: {
show: false,
},
axisLine: {
lineStyle: {
opacity: 0,
},
},
detail: {
show: false,
},
data: [
{
name: '',
value: 0
}
]
},
// 中间白色半圆
// {
// type: "gauge",
// radius: "80%", // 位置
// center: ["50%", "85%"],
// min: 0,
// max: 100,
// startAngle: 180,
// endAngle: 0,
// axisLine: {
// show: true,
// lineStyle: {
// // 轴线样式
// width: 120, // 宽度
// color: [
// [
// 1,
// new echarts.graphic.RadialGradient(0.5, 1, 1, [
// {
// offset: 1,
// color: "rgba(16, 129, 255,0.15)",
// },
// {
// offset: 0.72,
// color: "rgba(16, 129, 255,0.05)",
// },
// {
// offset: 0.7,
// color: "rgba(16, 129, 255,0.4)",
// },
// {
// offset: 0.401,
// color: "rgba(16, 129, 255,0.05)",
// },
// {
// offset: 0.4,
// color: "rgba(16, 129, 255,0.8)",
// },
// {
// offset: 0,
// color: "rgba(16, 129, 255,0.8)",
// },
// ]),
// ],
// ], // 颜色
// },
// },
// axisTick: {
// // 刻度
// show: false,
// },
// splitLine: {
// // 分割线
// show: false,
// },
// axisLabel: {
// // 刻度标签
// show: false,
// },
// pointer: {
// // 仪表盘指针
// show: false,
// },
// detail: {
// // 仪表盘详情
// show: false,
// },
// },
],
};
// 使用刚指定的配置项和数据显示图表。
this.charts.setOption(option, true);
// // 切换图例时触发
// this.charts.on('legendselectchanged', function(obj) {
// console.log(obj, 'legendselectchanged----->>>')
// })
window.addEventListener("resize", this.selfAdaption);
},
// 自适应
selfAdaption() {
if (!this.charts) return;
this.charts.resize();
this.drawGauge();
},
},
};
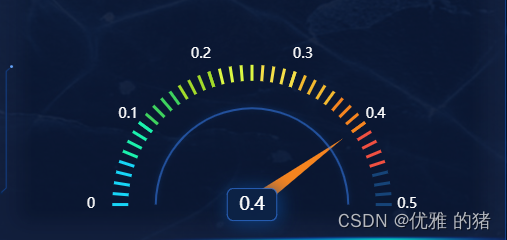
</script>示例3
<template>
  <div :id="id" style="width: 100%; height: 100%"></div>
</template>
<script>
import * as echarts from "echarts";
import { fontChart } from "@/utils/echartPxToRem";
export default {
  data() {
    return {
      charts: "",
    };
  },
  props: {
    id: {
      type: String,
      required: true,
    },
    min: {
      type: String,
      default: '0'
    },
    max: {
      type: String,
      default: '0.5'
    },
    gaugeData: {
      type: Array,
      default: () => [
        {
          name: "PUE",
          value: 0.4
        }
      ]
    },
    splitNumber: {
      type: String,
      default: '5'
    }
  },
  watch: {
    gaugeData() {
      this.drawGauge()
    }
  },
  mounted() {
    this.drawGauge();
  },
  destroyed() {
    window.removeEventListener("resize", this.selfAdaption);
  },
  methods: {
    drawGauge() {
      // 基于准备好的dom,初始化echarts实例
      this.charts = echarts.init(document.getElementById(this.id));
      const colorFormatOnChart = (value = 0,max = 2) => {
        if(value / max == 0) {
          return [[1, '#164478']]
        }else if (value/max < 0.1) {
          return [[0.1, '#17D5F7'],
            [1, '#164478']]
        } else if (value / max < 0.2) {
          return [[0.1, '#17D5F7'],
            [0.2, '#1BF0AC'],
            [1, '#164478']]
        } else if (value / max < 0.3) {
          return [[0.1, '#17D5F7'],
            [0.2, '#1BF0AC'],
            [0.3, '#3ED25E'],
            [1, '#164478']]
        } else if (value / max < 0.4) {
          return [[0.1, '#17D5F7'],
            [0.2, '#1BF0AC'],
            [0.3, '#3ED25E'],
            [0.4, '#A2DA2A'],
            [1, '#164478']]
        } else if (value / max < 0.5) {
          return [[0.1, '#17D5F7'],
            [0.2, '#1BF0AC'],
            [0.3, '#3ED25E'],
            [0.4, '#A2DA2A'],
            [0.5, '#DBF743'],
            [1, '#164478']]
        } else if (value / max < 0.6) {
          return [[0.1, '#17D5F7'],
            [0.2, '#1BF0AC'],
            [0.3, '#3ED25E'],
            [0.4, '#A2DA2A'],
            [0.5, '#DBF743'],
            [0.6, '#F4DE48'],
            [1, '#164478']]
        } else if (value / max < 0.7) {
          return [[0.1, '#17D5F7'],
            [0.2, '#1BF0AC'],
            [0.3, '#3ED25E'],
            [0.4, '#A2DA2A'],
            [0.5, '#DBF743'],
            [0.6, '#F4DE48'],
            [0.7, '#F3B92F'],
            [1, '#164478']]
        } else if (value / max < 0.8) {
          return [[0.1, '#17D5F7'],
            [0.2, '#1BF0AC'],
            [0.3, '#3ED25E'],
            [0.4, '#A2DA2A'],
            [0.5, '#DBF743'],
            [0.6, '#F4DE48'],
            [0.7, '#F3B92F'],
            [0.8, '#F5841F'],
            [1, '#164478']]
        } else if(value / max < 0.9) {
          return [[0.1, '#17D5F7'],
            [0.2, '#1BF0AC'],
            [0.3, '#3ED25E'],
            [0.4, '#A2DA2A'],
            [0.5, '#DBF743'],
            [0.6, '#F4DE48'],
            [0.7, '#F3B92F'],
            [0.8, '#F5841F'],
            [0.9, '#F15041'],
            [1, '#164478']]
        } else {
          return [[0.1, '#17D5F7'],
            [0.2, '#1BF0AC'],
            [0.3, '#3ED25E'],
            [0.4, '#A2DA2A'],
            [0.5, '#DBF743'],
            [0.6, '#F4DE48'],
            [0.7, '#F3B92F'],
            [0.8, '#F5841F'],
            [0.9, '#F15041'],
            [1, '#F12C2C']]
        }
      }
      // 指定图表的配置项和数据
      let option = {
        // backgroundColor: "black",
        tooltip: {
          show: false,
          formatter: "{a} <br/>{b} : {c}%",
        },
        series: [
          {
            type: "gauge",
            radius: "115%",
            startAngle: "180",
            endAngle: "0",
            pointer: {
              show: true,
              length: '80%',
              width: fontChart(8),
              // offsetCenter: [0, '-55%'],
              itemStyle:{
                color:"#207ade",
                // opacity: 0.7
              },
            },
            min: parseFloat(this.min),
            max: parseFloat(this.max),
            splitNumber: parseFloat(this.splitNumber),
            center: ["50%", "85%"], //整体的位置设置
            detail: {
              offsetCenter: [0, '0'], // x, y,单位px 偏移位置
              textStyle: { // 其余属性默认使用全局文本样式,详见TEXTSTYLE
                color: '#ffffff',
                fontSize: fontChart(18),
                borderColor: '#3982f7', // 值域边框颜色
                //边框颜色
                borderWidth: 0.6,
                shadowColor:"#0c4083",//阴影颜色
                shadowOffsetX: 2,//阴影水平方向上的偏移距离
                shadowOffsetY: 2,//阴影垂直方向上的偏移距离
                shadowBlur: fontChart(20),
                borderRadius: fontChart(6),
                padding: [8,12,6,12]
              },
              backgroundColor: '#0c2144',
              formatter: function(value) {
                return value
              }
            },
            data: this.gaugeData,
            title: {
              show: false,
            },
            axisLine: {
              show: true,
              lineStyle: {
                color: colorFormatOnChart(this.gaugeData[0].value, parseFloat(this.max)),
                width: 0,
                // shadowBlur: 15,
                // shadowColor: '#B0C4DE',
                shadowOffsetX: 0,
                shadowOffsetY: 0,
                opacity: 1
              }
            },
            axisTick: {
              show: true,
              lineStyle: {
                color: 'auto', // 很关键
                width: 3,
                cap: 'round'
              },
              length: fontChart(16),
              splitNumber: 8
            },
            splitLine: {
              show: false,
              length: fontChart(25),
              lineStyle: {
                color: "#00377a",
                width: 2,
                type: "solid",
              },
            },
            axisLabel: {
              show: false,
              // formatter: function (v) {
              //   return v.toFixed(0);
              // },
            },
            animationDuration: 4000,
          },
          {
            name: "内圈", //刻度背景
            type: "gauge",
            z: 2,
            radius: "80%",
            startAngle: "180",
            endAngle: "0",
            center: ["50%", "85%"], //整体的位置设置
            axisLine: {
              // 坐标轴线
              lineStyle: {
                // 属性lineStyle控制线条样式
                color: [[1, "rgba(57, 130, 247, .5)"]],
                shadowColor: "#0c4189",
                shadowBlur: 5,
                shadowOffsetY: -1,
                width: 2,
                opacity: 1, //刻度背景宽度
              },
            },
            splitLine: {
              show: false,
            },
            axisLabel: {
              show: false,
              formatter: function (v) {
                return v.toFixed(0);
              },
            },
            pointer: {
              show: false,
            },
            axisTick: {
              show: false,
            },
            detail: {
              show: 0,
            },
          },
          {
            name: "白色圈刻度",
            type: "gauge",
            radius: "140%",
            startAngle: 180, //刻度起始
            endAngle: 0, //刻度结束
            min: parseFloat(this.min),
            max: parseFloat(this.max),
            splitNumber: parseFloat(this.splitNumber),
            z: 4,
            axisTick: {
              show: false,
            },
            center: ["50%", "85%"], //整体的位置设置
            splitLine: {
              length: fontChart(0), //刻度节点线长度
              lineStyle: {
                width: 2,
                color: "#018DFF",
              }, //刻度节点线
            },
            axisLabel: {
              color: "rgba(255,255,255,8)",
              fontSize: fontChart(14),
              // formatter: function (v) {
              //   return v.toFixed(0);
              // },
            }, //刻度节点文字颜色
            pointer: {
              show: false,
            },
            axisLine: {
              lineStyle: {
                opacity: 0,
              },
            },
            detail: {
              show: false,
            },
            data: [
              {
                name: '',
                value: 0
              }
            ]
          },
        ],
      };
      // 使用刚指定的配置项和数据显示图表。
      this.charts.setOption(option, true);
      // // 切换图例时触发
      // this.charts.on('legendselectchanged', function(obj) {
      //   console.log(obj, 'legendselectchanged----->>>')
      // })
      window.addEventListener("resize", this.selfAdaption);
    },
    // 自适应
    selfAdaption() {
      if (!this.charts) return;
      this.charts.resize();
      this.drawGauge();
    },
  },
};
</script>
示例4
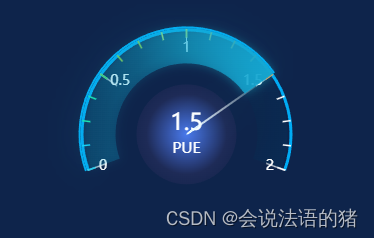
背景色:rgba(14, 36, 75, 1)
<template>
<div :id="id" style="width: 100%; height: 100%"></div>
</template>
<script>
import * as echarts from "echarts";
import { fontChart } from "@/utils/echartPxToRem";
export default {
data() {
return {
charts: "",
};
},
props: {
id: {
type: String,
required: true,
},
min: {
type: String,
default: "0",
},
max: {
type: String,
default: "2",
},
gaugeData: {
type: Array,
default: () => [
{
name: "PUE",
value: 1.5,
},
],
},
splitNumber: {
type: String,
default: "4",
},
digit: {
type: Number,
default: 1
}
},
watch: {
gaugeData() {
this.drawGauge();
},
},
mounted() {
this.drawGauge();
window.addEventListener("resize", this.chartsResize);
},
destroyed() {
window.removeEventListener("resize", this.chartsResize);
},
methods: {
drawGauge() {
// 基于准备好的dom,初始化echarts实例
this.charts = echarts.init(document.getElementById(this.id));
const colorFormatOnChart = (value = 0,max = 2) => {
if(value / max == 0) {
return [[1, '#fff']]
}else if (value/max < 0.1) {
return [[0.1, '#17D5F7'],
[1, '#fff']]
} else if (value / max < 0.2) {
return [[0.1, '#17D5F7'],
[0.2, '#1BF0AC'],
[1, '#fff']]
} else if (value / max < 0.3) {
return [[0.1, '#17D5F7'],
[0.2, '#1BF0AC'],
[0.3, '#3ED25E'],
[1, '#fff']]
} else if (value / max < 0.4) {
return [[0.1, '#17D5F7'],
[0.2, '#1BF0AC'],
[0.3, '#3ED25E'],
[0.4, '#A2DA2A'],
[1, '#fff']]
} else if (value / max < 0.5) {
return [[0.1, '#17D5F7'],
[0.2, '#1BF0AC'],
[0.3, '#3ED25E'],
[0.4, '#A2DA2A'],
[0.5, '#DBF743'],
[1, '#fff']]
} else if (value / max < 0.6) {
return [[0.1, '#17D5F7'],
[0.2, '#1BF0AC'],
[0.3, '#3ED25E'],
[0.4, '#A2DA2A'],
[0.5, '#DBF743'],
[0.6, '#F4DE48'],
[1, '#fff']]
} else if (value / max < 0.7) {
return [[0.1, '#17D5F7'],
[0.2, '#1BF0AC'],
[0.3, '#3ED25E'],
[0.4, '#A2DA2A'],
[0.5, '#DBF743'],
[0.6, '#F4DE48'],
[0.7, '#F3B92F'],
[1, '#fff']]
} else if (value / max < 0.8) {
return [[0.1, '#17D5F7'],
[0.2, '#1BF0AC'],
[0.3, '#3ED25E'],
[0.4, '#A2DA2A'],
[0.5, '#DBF743'],
[0.6, '#F4DE48'],
[0.7, '#F3B92F'],
[0.8, '#F5841F'],
[1, '#fff']]
} else if(value / max < 0.9) {
return [[0.1, '#17D5F7'],
[0.2, '#1BF0AC'],
[0.3, '#3ED25E'],
[0.4, '#A2DA2A'],
[0.5, '#DBF743'],
[0.6, '#F4DE48'],
[0.7, '#F3B92F'],
[0.8, '#F5841F'],
[0.9, '#F15041'],
[1, '#fff']]
} else {
return [[0.1, '#17D5F7'],
[0.2, '#1BF0AC'],
[0.3, '#3ED25E'],
[0.4, '#A2DA2A'],
[0.5, '#DBF743'],
[0.6, '#F4DE48'],
[0.7, '#F3B92F'],
[0.8, '#F5841F'],
[0.9, '#F15041'],
[1, '#F12C2C']]
}
}
// 指定图表的配置项和数据
let option = {
series: [
// 渲染部分(指针划过的部分)
{
type: "gauge",
center: ["50%", "55%"],
radius: "106", // 1行3个
splitNumber: Number(this.splitNumber),
min: Number(this.min),
max: Number(this.max),
startAngle: 200,
endAngle: -20,
itemStyle: {
color: new echarts.graphic.LinearGradient(0, 0, 1, 0, [
{ offset: 0, color: "rgba(21, 165, 208, 0.1)" },
{ offset: 0.3, color: "rgba(21, 165, 208, 0.3)" },
{ offset: 0.5, color: "rgba(21, 165, 208, 0.5)" },
{ offset: 0.7, color: "rgba(21, 165, 208, 0.7)" },
{ offset: 1, color: "rgba(21, 165, 208, 1)" },
]),
shadowColor: "rgba(30, 217, 241,0.45)",
shadowBlur: 10,
},
progress: {
show: true,
width: 35,
},
axisTick: {
show: false,
}, //刻度样式
splitLine: {
show: false,
}, //分隔线样式
axisLine: {
show: false,
},
axisLabel: {
show: false,
},
pointer: {
show: 0,
},
detail: {
show: 0,
},
data: [
{
value: this.gaugeData[0].value || 0,
},
],
},
// 外侧颜色
{
type: "gauge",
center: ["50%", "55%"],
radius: 106, // 1行3个
splitNumber: 10,
min: Number(this.min),
max: Number(this.max),
startAngle: 200,
endAngle: -20,
axisTick: {
show: false,
},
//刻度样式
splitLine: {
show: false,
},
//分隔线样式
axisLine: {
show: true,
lineStyle: {
width: 3,
color: [[1, "rgba(0, 171, 244, 1)"]],
},
},
axisLabel: {
show: false,
},
pointer: {
show: 0,
},
detail: {
show: 0,
},
},
// 中间阴影部分
{
type: "gauge",
center: ["50%", "55%"],
radius: 101, // 1行3个
splitNumber: 10,
min: Number(this.min),
max: Number(this.max),
startAngle: 200,
endAngle: -20,
axisLine: {
// 坐标轴线
lineStyle: {
// 属性lineStyle控制线条样式
color: [
[
100 / 100,
new echarts.graphic.RadialGradient(0.5, 0.6, 1, [
{
offset: 0,
color: "rgba(12, 32, 67, 0.9)",
},
{
offset: 1,
color: "rgba(10, 45, 86, 1)",
},
]),
],
[1, "rgba(255,255,255, 0)"],
],
fontSize: fontChart(20),
width: fontChart(30),
opacity: 1, //刻度背景宽度
},
},
splitLine: {
show: false,
},
axisLabel: {
show: false,
},
pointer: {
show: false,
},
axisTick: {
show: false,
},
detail: {
show: 0,
},
},
// 刻度
{
type: "gauge",
center: ["50%", "55%"],
radius: 125, // 1行3个
splitNumber: Number(this.splitNumber),
min: Number(this.min),
max: Number(this.max),
startAngle: 200,
endAngle: -20,
axisTick: {
splitNumber: Number(this.splitNumber),
show: true,
lineStyle: {
// color: colorFormatOnChart(this.gaugeData[0].value, parseFloat(this.max)),
color: 'auto',
width: 1.5,
},
length: 8,
},
//刻度样式
splitLine: {
show: true,
length: 20,
lineStyle: {
color: "#fff",
width: 1,
},
}, //分隔线样式
axisLine: {
show: true,
lineStyle: {
color: colorFormatOnChart(this.gaugeData[0].value, parseFloat(this.max)),
width: 10,
shadowOffsetX: 0,
shadowOffsetY: 0,
opacity: 0
}
},
axisLabel: {
show: true,
distance: 2,
textStyle: {
color: "#fff",
fontSize: fontChart(14),
},
},
pointer: {
show: 0,
},
detail: {
show: 0,
},
},
// 指针
{
type: "gauge",
center: ["50%", "55%"],
radius: 108,
startAngle: 200,
endAngle: -20,
min: Number(this.min),
max: Number(this.max),
itemStyle: {
color: [
[
100 / 100,
new echarts.graphic.LinearGradient(0, 0, 1, 0, [
{ offset: 0, color: "rgba(31, 210, 233, 0.1)" },
{ offset: 1, color: "rgba(31, 210, 233, 1)" },
]),
],
[1, "rgba(255,255,255, 0)"]
],
shadowColor: "rgba(29, 211, 237,0.45)",
shadowBlur: 30,
},
progress: {
show: true,
width: 2,
itemStyle: {
color: "rgba(4, 173, 239, 1)",
},
},
pointer: {
icon: "path://M2.9,0.7L2.9,0.7c1.4,0,2.6,1.2,2.6,2.6v115c0,1.4-1.2,2.6-2.6,2.6l0,0c-1.4,0-2.6-1.2-2.6-2.6V3.3C0.3,1.9,1.4,0.7,2.9,0.7z",
width: 2,
length: "99%",
offsetCenter: [0, 0],
itemStyle: {
color: {
type: "line",
x: 0,
y: 0,
x2: 0,
y2: 1,
colorStops: [
{
offset: 0,
color: "rgba(238, 253, 255, 0)", // 100% 处的颜色
},
{
offset: 1,
color: "rgba(238, 253, 255, 1)", // 0% 处的颜色 #000613','#00334f', '#77f0ff'
},
],
},
},
},
axisLine: {
show: false,
},
axisTick: {
show: false,
},
splitLine: {
show: false,
},
axisLabel: {
show: false,
},
detail: {
valueAnimation: true,
width: "100%",
offsetCenter: [0, 0],
fontSize: fontChart(23),
fontWeight: "normal",
color: "#fff",
formatter: `${this.gaugeData[0].value.toFixed(this.digit)}\n{b|${this.gaugeData[0].name || ''}}`,
rich: {
a: {
fontSize: fontChart(18),
lineHeight: fontChart(10),
align: "center"
},
b: {
fontSize: fontChart(15),
color: "#fff",
lineHeight: fontChart(20),
align: "center",
fontWeight: 500
}
}
},
data: [
{
value: this.gaugeData[0].value || 0,
},
],
},
//内圆
{
type: "pie",
radius: 50,
center: ["50%", "55%"],
z: 1,
animation: false,
itemStyle: {
color: new echarts.graphic.RadialGradient(
0.5,
0.5,
0.8,
[
{
offset: 0,
color: "#4978EC",
},
{
offset: 0.5,
color: "#1E2B57",
},
{
offset: 1,
color: "#0a1d42",
},
],
false
),
label: {
show: false,
},
labelLine: {
show: false,
}
},
hoverAnimation: false,
label: {
show: false,
},
tooltip: {
show: false,
},
data: [100],
}
]
}
// 使用刚指定的配置项和数据显示图表。
this.charts.setOption(option, true);
},
// 自适应
chartsResize() {
if (!this.charts) return;
this.charts.resize();
this.drawGauge();
},
},
};
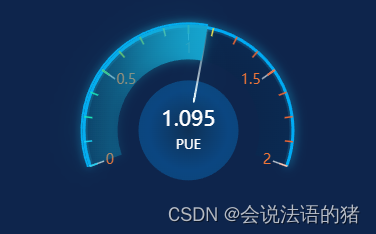
</script>示例5
<template>
<div :id="id" style="width: 100%; height: 100%"></div>
</template>
<script>
import * as echarts from "echarts";
import { fontChart } from "@/utils/echartPxToRem";
export default {
data() {
return {
charts: "",
};
},
props: {
id: {
type: String,
required: true,
},
min: {
type: String,
default: "0",
},
max: {
type: String,
default: "2",
},
gaugeData: {
type: Array,
default: () => [
{
name: "PUE",
value: 1.095,
},
],
},
splitNumber: {
type: String,
default: "4",
},
digit: {
type: Number,
default: 3
}
},
watch: {
gaugeData() {
this.drawGauge();
},
},
mounted() {
this.drawGauge();
window.addEventListener("resize", this.chartsResize);
},
destroyed() {
window.removeEventListener("resize", this.chartsResize);
},
methods: {
drawGauge() {
// 基于准备好的dom,初始化echarts实例
this.charts = echarts.init(document.getElementById(this.id));
const colorFormatOnChart = (value = 0,max = 2) => {
if(value / max == 0) {
return [[1, '#ec6633']]
}else if (value/max < 0.1) {
return [[0.1, '#17D5F7'],
[1, '#ec6633']]
} else if (value / max < 0.2) {
return [[0.1, '#17D5F7'],
[0.2, '#1BF0AC'],
[1, '#ec6633']]
} else if (value / max < 0.3) {
return [[0.1, '#17D5F7'],
[0.2, '#1BF0AC'],
[0.3, '#3ED25E'],
[1, '#ec6633']]
} else if (value / max < 0.4) {
return [[0.1, '#17D5F7'],
[0.2, '#1BF0AC'],
[0.3, '#3ED25E'],
[0.4, '#A2DA2A'],
[1, '#ec6633']]
} else if (value / max < 0.5) {
return [[0.1, '#17D5F7'],
[0.2, '#1BF0AC'],
[0.3, '#3ED25E'],
[0.4, '#A2DA2A'],
[0.5, '#DBF743'],
[1, '#ec6633']]
} else if (value / max < 0.6) {
return [[0.1, '#17D5F7'],
[0.2, '#1BF0AC'],
[0.3, '#3ED25E'],
[0.4, '#A2DA2A'],
[0.5, '#DBF743'],
[0.6, '#F4DE48'],
[1, '#ec6633']]
} else if (value / max < 0.7) {
return [[0.1, '#17D5F7'],
[0.2, '#1BF0AC'],
[0.3, '#3ED25E'],
[0.4, '#A2DA2A'],
[0.5, '#DBF743'],
[0.6, '#F4DE48'],
[0.7, '#F3B92F'],
[1, '#ec6633']]
} else if (value / max < 0.8) {
return [[0.1, '#17D5F7'],
[0.2, '#1BF0AC'],
[0.3, '#3ED25E'],
[0.4, '#A2DA2A'],
[0.5, '#DBF743'],
[0.6, '#F4DE48'],
[0.7, '#F3B92F'],
[0.8, '#F5841F'],
[1, '#ec6633']]
} else if(value / max < 0.9) {
return [[0.1, '#17D5F7'],
[0.2, '#1BF0AC'],
[0.3, '#3ED25E'],
[0.4, '#A2DA2A'],
[0.5, '#DBF743'],
[0.6, '#F4DE48'],
[0.7, '#F3B92F'],
[0.8, '#F5841F'],
[0.9, '#F15041'],
[1, '#ec6633']]
} else {
return [[0.1, '#17D5F7'],
[0.2, '#1BF0AC'],
[0.3, '#3ED25E'],
[0.4, '#A2DA2A'],
[0.5, '#DBF743'],
[0.6, '#F4DE48'],
[0.7, '#F3B92F'],
[0.8, '#F5841F'],
[0.9, '#F15041'],
[1, '#F12C2C']]
}
}
// 指定图表的配置项和数据
let option = {
backgroundColor: '#0e254c',
series: [
// 渲染部分(指针划过的部分)
{
type: "gauge",
center: ["50%", "55%"],
radius: "106", // 1行3个
splitNumber: Number(this.splitNumber),
min: Number(this.min),
max: Number(this.max),
startAngle: 200,
endAngle: -20,
itemStyle: {
color: new echarts.graphic.LinearGradient(0, 0, 1, 0, [
{ offset: 0, color: "rgba(21, 165, 208, 0.1)" },
{ offset: 0.3, color: "rgba(21, 165, 208, 0.3)" },
{ offset: 0.5, color: "rgba(21, 165, 208, 0.5)" },
{ offset: 0.7, color: "rgba(21, 165, 208, 0.7)" },
{ offset: 1, color: "rgba(21, 165, 208, 1)" },
]),
shadowColor: "rgba(30, 217, 241,0.45)",
shadowBlur: 10,
},
progress: {
show: true,
width: 35,
},
axisTick: {
show: false,
}, //刻度样式
splitLine: {
show: false,
}, //分隔线样式
axisLine: {
show: false,
},
axisLabel: {
show: false,
},
pointer: {
show: 0,
},
detail: {
show: 0,
},
data: [
{
value: this.gaugeData[0].value || 0,
},
],
},
// 外侧颜色
{
type: "gauge",
center: ["50%", "55%"],
radius: 106, // 1行3个
splitNumber: 10,
min: Number(this.min),
max: Number(this.max),
startAngle: 200,
endAngle: -20,
axisTick: {
show: false,
},
//刻度样式
splitLine: {
show: false,
},
//分隔线样式
axisLine: {
show: true,
lineStyle: {
width: 3,
color: [[1, "rgba(0, 171, 244, 1)"]],
shadowBlur: 10,
shadowColor: '#17b5e4',
},
},
axisLabel: {
show: false,
},
pointer: {
show: 0,
},
detail: {
show: 0,
},
},
// 中间阴影部分
{
type: "gauge",
center: ["50%", "55%"],
radius: 101, // 1行3个
splitNumber: 10,
min: Number(this.min),
max: Number(this.max),
startAngle: 200,
endAngle: -20,
axisLine: {
// 坐标轴线
lineStyle: {
// 属性lineStyle控制线条样式
color: [
[
100 / 100,
new echarts.graphic.RadialGradient(0.5, 0.6, 1, [
{
offset: 0,
color: "rgba(12, 32, 67, 0.9)",
},
{
offset: 1,
color: "rgba(10, 45, 86, 1)",
},
]),
],
[1, "rgba(255,255,255, 0)"],
],
fontSize: fontChart(20),
width: fontChart(30),
opacity: 1, //刻度背景宽度
},
},
splitLine: {
show: false,
},
axisLabel: {
show: false,
},
pointer: {
show: false,
},
axisTick: {
show: false,
},
detail: {
show: 0,
},
},
// 刻度
{
type: "gauge",
center: ["50%", "55%"],
radius: 125, // 1行3个
splitNumber: Number(this.splitNumber),
min: Number(this.min),
max: Number(this.max),
startAngle: 200,
endAngle: -20,
axisTick: {
splitNumber: Number(this.splitNumber),
show: true,
lineStyle: {
// color: colorFormatOnChart(this.gaugeData[0].value, parseFloat(this.max)),
color: 'auto',
width: 1.5,
},
length: 8,
},
//刻度样式
splitLine: {
show: true,
length: 15,
lineStyle: {
color: "#fff",
width: 1,
},
}, //分隔线样式
axisLine: {
show: true,
lineStyle: {
color: colorFormatOnChart(this.gaugeData[0].value, parseFloat(this.max)),
width: 10,
shadowOffsetX: 0,
shadowOffsetY: 0,
opacity: 0
}
},
axisLabel: {
show: true,
distance: 12,
textStyle: {
color: "#ed7538",
fontSize: fontChart(14),
},
},
pointer: {
show: 0,
},
detail: {
show: 0,
},
},
// 指针
{
type: "gauge",
center: ["50%", "55%"],
radius: 108,
startAngle: 200,
endAngle: -20,
min: Number(this.min),
max: Number(this.max),
itemStyle: {
color: [
[
100 / 100,
new echarts.graphic.LinearGradient(0, 0, 1, 0, [
{ offset: 0, color: "rgba(31, 210, 233, 0.1)" },
{ offset: 1, color: "rgba(31, 210, 233, 1)" },
]),
],
[1, "rgba(255,255,255, 0)"]
],
shadowColor: "rgba(29, 211, 237,0.45)",
shadowBlur: 30,
},
progress: {
show: true,
width: 2,
itemStyle: {
color: "rgba(4, 173, 239, 1)",
},
},
pointer: {
icon: "path://M2.9,0.7L2.9,0.7c1.4,0,2.6,1.2,2.6,2.6v115c0,1.4-1.2,2.6-2.6,2.6l0,0c-1.4,0-2.6-1.2-2.6-2.6V3.3C0.3,1.9,1.4,0.7,2.9,0.7z",
width: 2,
length: "76%",
offsetCenter: [0, '-26%'], // 指针距离中心的距离
itemStyle: {
color: {
type: "line",
x: 0,
y: 0,
x2: 0,
y2: 1,
colorStops: [
{
offset: 0,
color: "rgba(238, 253, 255, 0)", // 100% 处的颜色
},
{
offset: 1,
color: "rgba(238, 253, 255, 1)", // 0% 处的颜色 #000613','#00334f', '#77f0ff'
},
],
},
},
},
axisLine: {
show: false,
},
axisTick: {
show: false,
},
splitLine: {
show: false,
},
axisLabel: {
show: false,
},
detail: {
valueAnimation: true,
width: "100%",
offsetCenter: [0, 0],
fontSize: fontChart(21),
fontWeight: "normal",
color: "#fff",
formatter: `${this.gaugeData[0].value == 0 ? this.gaugeData[0].value.toFixed(1) : this.gaugeData[0].value.toFixed(this.digit)}\n{b|${this.gaugeData[0].name || ''}}`,
rich: {
a: {
fontSize: fontChart(18),
lineHeight: fontChart(10),
align: "center"
},
b: {
fontSize: fontChart(13),
color: "#fff",
lineHeight: fontChart(20),
align: "center",
fontWeight: 500
}
}
},
data: [
{
value: this.gaugeData[0].value || 0,
},
],
},
//内圆
{
type: "pie",
radius: 50,
center: ["50%", "55%"],
z: 1,
animation: false,
itemStyle: {
color: new echarts.graphic.RadialGradient(
0.5,
0.5,
0.8,
[
{
offset: 0,
color: "rgb(14, 57, 93, .6)",
},
{
offset: 0.5,
color: "rgb(9, 92, 164, .6)",//#0e395d
},
{
offset: 1,
color: "#0e395d",
},
],
false
),
label: {
show: false,
},
labelLine: {
show: false,
}
},
hoverAnimation: false,
label: {
show: false,
},
tooltip: {
show: false,
},
data: [100],
}
]
}
// 使用刚指定的配置项和数据显示图表。
this.charts.setOption(option, true);
},
// 自适应
chartsResize() {
if (!this.charts) return;
this.charts.resize();
this.drawGauge();
},
},
};
</script>


 180
180


 被折叠的 条评论
为什么被折叠?
被折叠的 条评论
为什么被折叠?
 到【灌水乐园】发言


