股票市场行情走势图
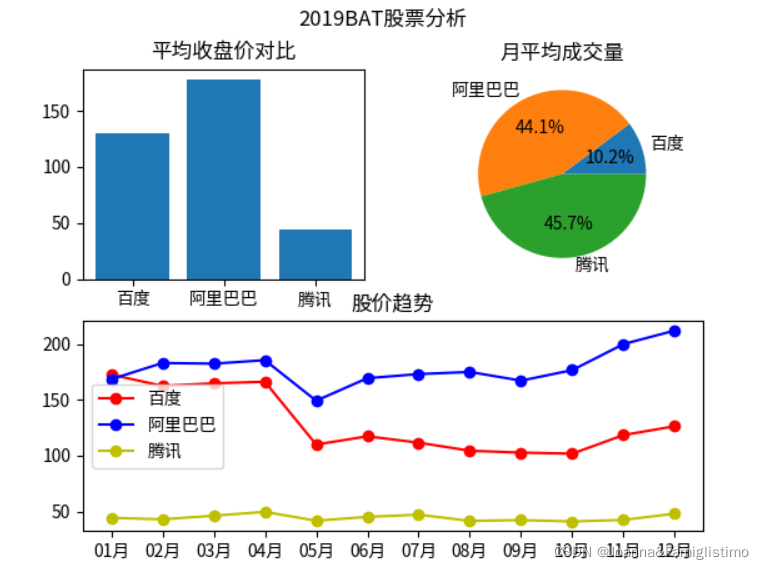
效果图
代码
import numpy as np
import matplotlib.pyplot as plt

plt.rcParams['font.family'] = ['Noto Sans CJK JP']

closing_bat = np.genfromtxt('收盘价.csv', delimiter=',')
vol_bat = np.genfromtxt('成交量.csv', delimiter=',')

labels = ['百度', '阿里巴巴', '腾讯']
dates = [
  '01月', '02月', '03月', '04月', '05月', '06月',
  '07月', '08月', '09月', '10月', '11月', '12月'
]
data=np.genfromtxt('收盘价.csv',delimiter=',')
data2=np.genfromtxt('成交量.csv',delimiter=',')

plt.suptitle('2019BAT股票分析')

ax1=plt.subplot(2,2,1)
ax1.set_title('平均收盘价对比')
y1=data.mean(axis=0)
ax1.bar(labels,y1)

ax2=plt.subplot(2,2,2)
ax2.set_title('月平均成交量')
x2=data2.mean(axis=0)
ax2.pie(x2,labels=labels,autopct='%0.1f%%')


ax3=plt.subplot(2,1,2)
ax3.set_title('股价趋势')
closing_baidu=data[:,0]
closing_alibaba=data[:,1]
closing_tencent=data[:,2]
ax3.plot(dates,closing_baidu,'ro-',label=labels[0])
ax3.plot(dates,closing_alibaba,'bo-',label=labels[1])
ax3.plot(dates,closing_tencent,'yo-',label=labels[2])
plt.legend()

plt.show()


 1698
1698

 被折叠的 条评论
为什么被折叠?
被折叠的 条评论
为什么被折叠?
 到【灌水乐园】发言


