


本章主要记录如何在react18项目中使用echarts实现数据可视化,分享给大家,仅供参考~
项目背景技术栈:react + ts + vite + less + react-router + axios + antd mobile + redux + echarts
1. 项目引入echarts
npm install echarts --save
或
yarn add echarts
2. 项目中新建一个页面Echart.tsx
import * as Echarts from "echarts";
import { MutableRefObject, useEffect, useRef } from "react";
import style from "../styles/chart.module.less";
type EChartsOption = echarts.EChartsOption
const pieOption: EChartsOption = {
title: {
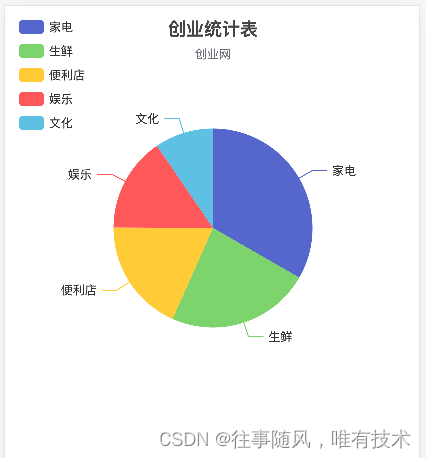
text: '创业统计表',
subtext: '创业网',
left: 'center'
},
tooltip: {
trigger: 'item'
},
legend: {
orient: 'vertical',
left: 'left'
},
series: [
{
name: '创业统计表',
type: 'pie',
radius: '50%',
data: [
{ value: 1048, name: '家电' },
{ value: 735, name: '生鲜' },
{ value: 580, name: '便利店' },
{ value: 484, name: '娱乐' },
{ value: 300, name: '文化' }
],
emphasis: {
itemStyle: {
shadowBlur: 10,
shadowOffsetX: 0,
shadowColor: 'rgba(0, 0, 0, 0.5)'
}
}
}
]
}
function Echart() {
const chartpie: MutableRefObject<any> = useRef(null);
const chartInit = () => {
const mychartpie = Echarts.init(chartpie.current);
mychartpie.setOption(pieOption, true);
window.onresize = () => {
mychartpie.resize();
};
};
useEffect(() => {
chartInit();
return () => {
window.onresize = null;
};
}, []);
return (
<>
<div ref={chartpie} className={style.chartbox}></div>
</>
);
}
export default Echart;3. 样式文件chart.module.less
.chartbox{
width: 100vw;
height: 400px;
padding: 8px;
margin-bottom: 10px;
box-sizing: border-box;
}
4. 效果展示
4. 具体详情请参阅:
1). 饼图官方链接:Examples - Apache ECharts
2). option中的参数说明文档:Documentation - Apache ECharts
3). 可参阅:vue3项目中使用echarts实现数据可视化


 209
209


 被折叠的 条评论
为什么被折叠?
被折叠的 条评论
为什么被折叠?
 到【灌水乐园】发言


