echarts 饼图默认放大某块扇形+随机颜色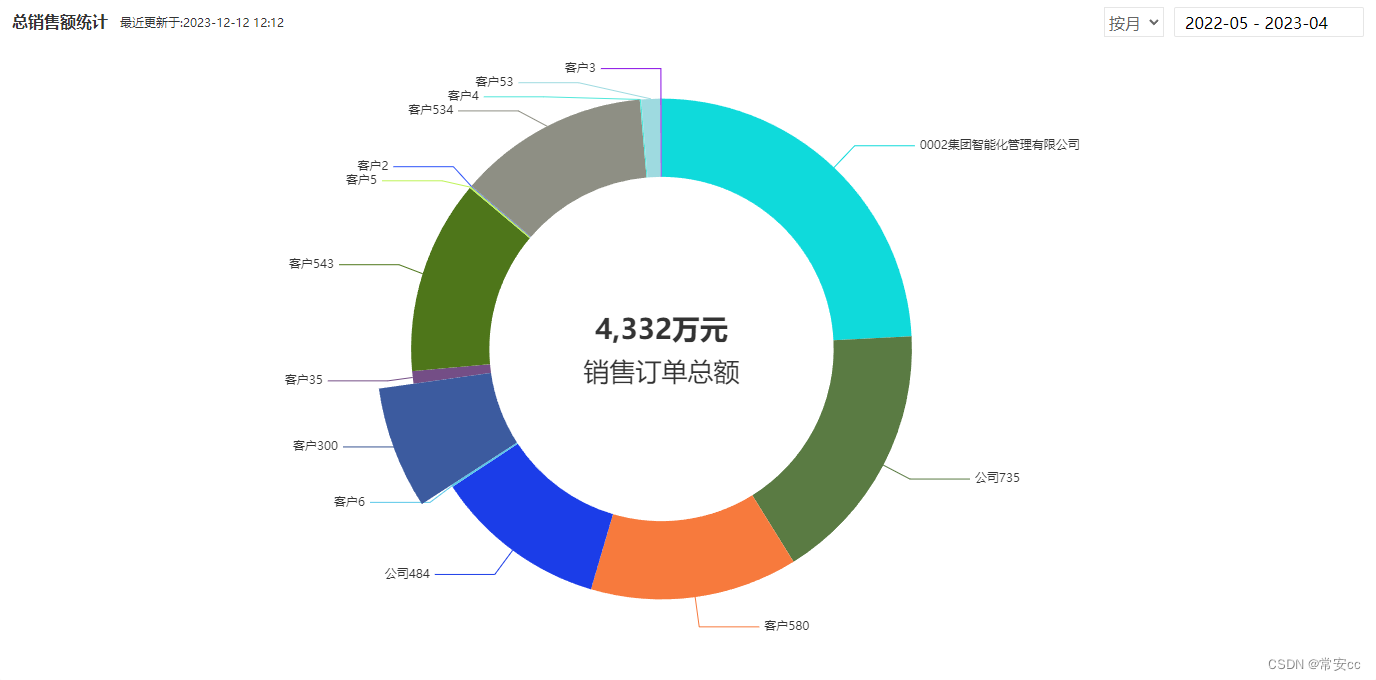
<!DOCTYPE html>
<html>
<head>
<meta charset="utf-8">
<title>销售统计</title>
<meta name="renderer" content="webkit">
<meta http-equiv="X-UA-Compatible" content="IE=edge,chrome=1">
<meta name="viewport"
content="width=device-width, initial-scale=1.0, minimum-scale=1.0, maximum-scale=1.0, user-scalable=0">
<style>
.title {
font-size: 16px;
font-family: Source Han Sans CN;
font-weight: bold;
line-height: 40px;
color: #333333;
opacity: 1;
display: flex;
align-items: center;
justify-content: space-between;
}
</style>
</head>
<body>
<div class="layui-row layui-col-space15" style="height: 100%;box-sizing: border-box;">
<div class="layui-col-md12" style="height: 100%;box-sizing: border-box;">
<div class="layui-card" style="height: 100%;box-sizing: border-box;">
<div class="layui-card-body" style="height: 100%;box-sizing: border-box;">
<div class="title">
<div style="display: flex;align-items: center;justify-content: space-between;">
<span style="margin-right: 12px;">总销售额统计</span>
<span style="font-size: 12px;font-weight: 400;">最近更新于:2023-12-12 12:12</span>
</div>
<div id="daterange"
style="width: 260px;height: 40px;font-weight: 400;display: flex;align-items: center;justify-content: space-between;">
<select id="select_type" name="select_type"
style="height: 30px;width: 60px;border-color: #e6e6e6;color: #666;">
<option value="0">按年</option>
<option value="1" selected>按月</option>
</select>
<div class="layui-input-inline rangeTime">
<input type="text" id="rangeTime_year" name="rangeTime_year" autocomplete="off"
class="layui-input" placeholder="选择时间,区间查找" style="display: none;height: 30px;">
<input type="text" id="rangeTime_month" name="rangeTime_month" autocomplete="off"
class="layui-input" placeholder="选择时间,区间查找" style="height: 30px;">
</div>
</div>
</div>
<div id="echarts1" style="width: 95%;height: calc(100% - 54px);position: absolute;"></div>
</div>
</div>
</div>
</div>
<script type="text/html" id="xuhao">
{{d.LAY_TABLE_INDEX+1}}
</script>
<script src="./echarts/echarts.min.js"></script>
<script>
var data = [
{ value: 1048, name: '0002集团智能化管理有限公司' },
{ value: 735, name: '公司735' },
{ value: 580, name: '客户580' },
{ value: 484, name: '公司484' },
{ value: 6, name: '客户6' },
{ value: 300, name: '客户300' },
{ value: 35, name: '客户35' },
{ value: 543, name: '客户543' },
{ value: 5, name: '客户5' },
{ value: 2, name: '客户2' },
{ value: 534, name: '客户534' },
{ value: 4, name: '客户4' },
{ value: 53, name: '客户53' },
{ value: 3, name: '客户3' },
];
var color = [];
var sum = 0;
for (var i = 0; i < data.length; i++) {
color.push(handleColors());
sum += data[i].value;
}
function handleColors() {
let color = ''
let r = Math.floor(Math.random() * 256)
let g = Math.floor(Math.random() * 256)
let b = Math.floor(Math.random() * 256)
color = `rgb(${r},${g},${b})`
return color
};
var myChart1 = echarts.init(document.getElementById("echarts1"));
var option1 = {
color: color,
tooltip: {
trigger: 'item',
backgroundColor: 'rgba(50,50,50,0.6)',
borderColor: 'rgba(50,50,50,0.01)',
formatter: function (params) {
var ss = (((params.value / sum) * 100).toFixed(2));
var res = `<div style="color:#fff"><p> <span style="display:inline-block;margin-right:4px;border-radius:10px;width:10px;height:10px;background-color:${params.color};"></span>` + params.name + ': ' + ss + '%</p></div>'
return res;
}
},
graphic: [{
type: "text",
left: "center",
top: "45%",
style: {
text: toThousand(sum) + '万元',
textAlign: "center",
fill: "#333",
fontSize: 28,
fontWeight: 700
}
}, {
type: "text",
left: "center",
top: "52%",
style: {
text: '销售订单总额',
textAlign: "center",
fill: "#333",
fontSize: 26,
fontWeight: 400
}
},],
series: [
{
type: 'pie',
radius: ['55%', '80%'],
data: data,
emphasis: {
scale: true,
scaleSize: 35,
},
labelLine: {
length: 30,
length2: 60,
},
}
]
};
myChart1.setOption(option1);
myChart1.dispatchAction({
type: 'highlight',
name: '客户300',
});
</script>
</body>
</html>


 1693
1693


 被折叠的 条评论
为什么被折叠?
被折叠的 条评论
为什么被折叠?
 到【灌水乐园】发言


