


正态分布的实现引用的另一位博主的分享详情,这里只分享如何优化柱状图效果。
先上效果图,如图所示,根据需求最多展示10条柱状图,如何在不影响折线图的情况下优化柱状图
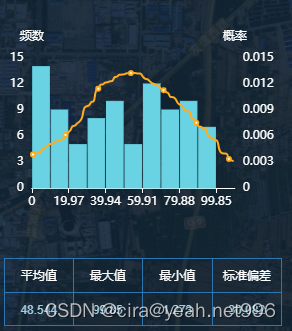
思路:将所有数据分成十个区间:(数据中的最大值 - 最小值)/10 得到间距,从最小值开始累加间距得到十一个数字做为x轴。遍历所有数据,得出各个区间对应的频数。此时柱状图所需要的数据都具备了。
由于此时柱状图与折线图共用一个x轴,改变柱状图x轴数据后,发现折线也发生了变化,不要慌!
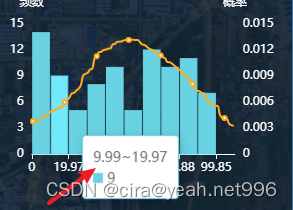
咱们的echarts很强大,可以双x轴双y轴同时存在,只需要将对应数据填进去,隐藏折线的x轴,核心属性yAxisIndex、xAxisIndex,详情可见代码。后面发现当鼠标经过显示提示框的时候,数据只显示一个数,不会显示区间,很简单,利用formatter改写,效果就出来了。

<!-- 查询 -->
<template>
<div class="statis">
<div ref="normalCurve" id="normalCurve" style="width:100%; height:260px"></div>
</div>
</template>
<script>
import * as echarts from 'echarts';
export default {
data () {
return {
// 数据
echartData:[]
}
},
computed: {
/**
* @Description: 有序数据源(方便操作)
*/
dataOrderBy() {
const data = this.echartData.concat([]); // 为防止 sort 方法修改原数组,对原数组进行拷贝,操作副本。
return data.sort((a, b) => a - b)
},
/**
* @Description: 数据整理。原数据整理为:{数据值 : 数据频率}
*/
dataAfterClean() {
// debugger
let res = {}
const data = this.dataOrderBy
for (let i = 0; i < this.echartData.length; i++) {
let key = parseFloat(this.echartData[i]).toFixed(1) // 这里保留 1 位小数
if (key !== "NaN" && parseFloat(key) === 0)
key = "0.0" //这个判断用来处理保留小数位后 -0.0 和 0.0 判定为不同 key 的 bug
if (res[key])
res[key] += 1
else
res[key] = 1
}
// console.log(res)
return res
},
/**
* @Description: 数据整理。返回源数据所有值(排序后)
*/
dataAfterCleanX() {
return Object.keys(this.dataAfterClean).sort((a, b) => a - b).map(t => parseFloat(t)
.toFixed(1)) // 保留 1 位小数
// return Object.keys(this.dataAfterClean) // 不保证顺序一致
},
/**
* @Description: 数据整理。返回源数据所有值对应的频率(排序后) -- 与 dataAfterCleanX 顺序一致
*/
dataAfterCleanY() {
let r = []
for (let i = 0; i < this.dataAfterCleanX.length; i++) {
r.push(this.dataAfterClean[this.dataAfterCleanX[i]])
}
return r
},
/**
* @Description: 数据整理。返回源数据所有值对应的频率,刻度更细致(保留 2 位小数) -- 与 dataAfterCleanX 顺序一致
*/
dataAfterCleanXSub() {
let r = []
for (let i = parseFloat(this.min.toFixed(1)); i <= parseFloat(this.max.toFixed(1)); i +=
0.01)
r.push(i.toFixed(2))
// console.log(r)
return r
},
/**
* @Description: 计算总和
*/
sum() {
if (this.echartData.length === 0) return 0
return this.echartData.reduce((prev, curr) => prev + curr)
},
/**
* @Description: 计算平均数。这里的平均数指的是数学期望、算术平均数
* */
average() {
return Math.round((this.sum / this.echartData.length) * 1000)/1000
},
/**
* @Description: 计算众数
* */
mode() {
return 0
},
/**
* @Description: 计算中位数
* */
median() {
const data = this.dataOrderBy
return (data[(data.length - 1) >> 1] + data[data.length >> 1]) / 2
},
/**
* @Description: 计算偏差
* */
deviation() {
// 1、求平均数
const avg = this.average
// 2、返回偏差。 f(x) = x - avg
return this.echartData.map(x => x - avg)
},
/**
* @Description: 计算总体/样本方差
* */
variance() {
if (this.echartData.length === 0) return 0
// 1、求偏差
const dev = this.deviation
// 2、求偏差平方和
const sumOfSquOfDev = dev.map(x => x * x).reduce((x, y) => x + y)
// 3、返回方差
return sumOfSquOfDev / (this.isSample ? (this.echartData.length - 1) : this.echartData.length)
},
/**
* @Description: 计算总体/样本标准差
* */
standardDeviation() {
return Math.round(Math.sqrt(this.variance) * 1000)/1000
},
/**
* @Description: 计算一倍标准差范围
* */
standarDevRangeOfOne() {
return {
low: this.average - 1 * this.standardDeviation,
up: this.average + 1 * this.standardDeviation
}
},
/**
* @Description: 计算三倍标准差范围
* */
standarDevRangeOfTwo() {
return {
low: this.average - 2 * this.standardDeviation,
up: this.average + 2 * this.standardDeviation
}
},
/**
* @Description: 计算三倍标准差范围
* */
standarDevRangeOfThree() {
return {
low: this.average - 3 * this.standardDeviation,
up: this.average + 3 * this.standardDeviation
}
},
/**
* @Description: 计算最小值
* */
min() {
return Math.round(Math.min.apply(null, this.echartData) * 1000)/1000
},
/**
* @Description: 计算最大值
* */
max() {
return Math.round(Math.max.apply(null, this.echartData) * 1000)/1000
},
/**
* @Description: 正态分布(高斯分布)计算公式
* */
normalDistribution() {
// 计算公式: `f(x) = (1 / (\sqrt {2\pi} \sigma)) e^(-(x-\mu)^2/(2\sigma^2))`
// return (1 / Math.sqrt(2 * Math.PI) * a) * (Math.exp(-1 * ((x - u) * (x - u)) / (2 * a * a)))
let res = []
for (let i = 0; i < this.dataAfterCleanX.length; i++) {
const x = Number(this.dataAfterCleanX[i])
const a = Number(this.standardDeviation)
const u = Number(this.average)
const y = (1 / (Math.sqrt(2 * Math.PI) * a)) * (Math.exp(-1 * ((x - u) * (x - u)) / (2 *
a * a)))
res.push(y)
if (x == 11.8)
console.log(y) // 正态分布峰值,用于验证
}
return res
},
},
mounted() {
this.echartData =[99.85,23.653,62.671,17.093,75.604,49.437,62.031,35.975,79.041,73.317,18.736,7.638,2.082,87.144,80.564,99.314,71.811,55.683,67.171,34.904,6.764,75.739,82.114,22.921,48.128,63.501,40.429,88.197,41.007,13.164,9.338,95.234,51.261,85.981,93.361,44.03,25.983,8.131,47.064,58.49,13.161,3.975,37.19,11.064,8.906,69.079,83.182,32.337,65.025,1.734,43.583,66.638,16.331,30.999,75.077,88.839,65.649,69.227,51.386,36.263,34.586,78.527,1.273,15.344,58.048,47.627,82.981,43.338,69.881,72.724,60.019,5.585,98.391,6.872,87.639,82.313,46.146,95.438,61.383,24.055,94.989,4.977,73.349,15.027,25.595,8.459,36.93,12.116,2.614]
},
methods: {
initChartsData(ref) {
let chart = this.$refs[ref]
if (!chart) return
chart = echarts.init(chart)
// 柱状图显示10个数据段,将所有数据排序后,最大值/10获取段间距数,从0开始累加,得到o1,此时o1不包括最大值
// o1: [0, 7.86, 15.71, 23.56, 31.42, 39.27, 47.12, 54.97, 62.83, 70.68, 78.53]
// o2在o1基础上加上最大值
// o2 :[0, 7.86, 15.71, 23.56, 31.42, 39.27, 47.12, 54.97, 62.83, 70.68, 78.53, 86.39]
let o1 = [],o2 = [],num = this.dataOrderBy[this.dataOrderBy.length - 1] / 10
for (let i = 0,len = this.dataOrderBy[this.dataOrderBy.length - 1];i<=len;i+=num){
o1.push(Math.ceil(i * 100)/ 100)
}
o2 = [...o1,Math.ceil((o1[o1.length - 1] + num) * 100) / 100]
// console.log(o1,o2)
// 计算每个数在间隔内出现的频率
let barNum = []
o1.forEach(el=>{
// debugger
let num = 0
if(el) {
this.dataOrderBy.forEach(item=>{
if(item <= el) {
num += 1
}
})
if(!barNum.length) {
barNum.push(num)
}else {
let a = null
barNum.forEach(q=>{
a += q
})
barNum.push(num - a)
}
}
})
// console.log(o1,o2,barNum)
// Echarts 图的配置
let options = {
// Echarts 图 -- 工具
tooltip: {
formatter:function(params,ticket,callback) {
// console.log(params)
if(params.componentSubType === 'bar') {
const html = `<div>
<div>${o2[params.dataIndex]}~${o2[params.dataIndex + 1]||''}</div>
<div><span style="width:10px;height:10px;display: inline-block;background:${params.color}"></span> ${params.value}</div>
</div>`;
return html;
}
if(params.componentSubType === 'line') {
const html = `<div>
<div>${params.seriesName}</div>
<div><span style="width:10px;height:10px;display: inline-block;background:${params.color};border-radius:50%"></span>${params.name} ${params.value}</div>
</div>`;
return html;
}
if(params.componentType === 'markLine') {
const html = `<div>
<div>${params.name}</div>
<div>${params.value}</div>
</div>`;
return html;
}
}
},
// Echarts 图 -- 图例
legend: {
data: ['f(x)']
},
grid:{
right: "17%"
},
// Echarts 图 -- x 坐标轴刻度 -- 正态分布数值
xAxis: [
{
data: o1,
show:false
},
{
data:o2,
position: 'bottom',
boundaryGap: false,
axisPointer: { show: false },
axisLine: {
lineStyle: {
color: '#ffffff'
}
},
axisLabel: {
interval: ref==='normalCurve2'? 0:1
// rotate: 45
// formatter:function(value){
// return value.split("").join("\n");
// }
}
},
{
data: this.dataAfterCleanX,
axisLine: {
lineStyle: {
color: '#ffffff'
}
},
show:false
}
],
// Echarts 图 -- y 坐标轴刻度
yAxis: [
{
type: 'value',
name: '频数',
position: 'left',
// 网格线
splitLine: {
show: false
},
axisLine: {
lineStyle: {
color: '#ffffff'
}
},
axisLabel: {
formatter: '{value}'
},
// show:false,
boundaryGap: [0.1, 0.1]
},
{
type: 'value',
name: '概率',
position: 'right',
// 网格线
splitLine: {
show: false
},
axisLine: {
lineStyle: {
color: '#ffffff'
}
},
axisLabel: {
formatter: '{value}'
}
},
],
// Echarts 图 -- y 轴数据
series: [
{
name: '源数据', // y 轴名称
type: 'bar', // y 轴类型
yAxisIndex: 0,
barGap: 0,
barWidth: '90%',
itemStyle: {
normal: {
show: true,
color: 'rgba(105, 211, 227, 1)', //柱子颜色
borderColor: 'rgba(105, 211, 227, 1)' //边框颜色
}
},
// data: this.dataAfterCleanY, // y 轴数据 -- 源数据
data: barNum , // y 轴数据 -- 源数据
},
{
name: '正态分布', // y 轴名称
type: 'line', // y 轴类型
// symbol: 'none', //去掉折线图中的节点
itemStyle: {
normal: {
show: true,
color: 'rgba(255, 172, 29, 1)', //柱子颜色
}
},
// showSymbol: false,
smooth: true, //true 为平滑曲线
yAxisIndex: 1,
xAxisIndex: 2,
data: this.normalDistribution, // y 轴数据 -- 正态分布
// 警示线
markLine: {
symbol: ['none'], // 箭头方向
lineStyle: {
type: "silent",
color: "green",
},
itemStyle: {
normal: {
show: true,
color: 'black'
}
},
label: {
show: true,
position: "middle"
},
data: [{
name: '一倍标准差',
xAxis: this.standarDevRangeOfOne.low.toFixed(1),
// 当 n 倍标准差在坐标轴外时,将其隐藏,否则它会默认显示在最小值部分,容易引起混淆
lineStyle: {
opacity: (this.min > this.standarDevRangeOfOne
.low) ? 0 : 1
},
label: {
show: !(this.min > this.standarDevRangeOfOne.low)
}
}, {
name: '一倍标准差',
xAxis: this.standarDevRangeOfOne.up.toFixed(1),
lineStyle: {
opacity: (this.max < this.standarDevRangeOfOne.up) ?
0 : 1
},
label: {
show: !(this.max < this.standarDevRangeOfOne.up)
}
}, {
name: '二倍标准差',
xAxis: this.standarDevRangeOfTwo.low.toFixed(1),
lineStyle: {
opacity: (this.min > this.standarDevRangeOfTwo
.low) ? 0 : 1
},
label: {
show: !(this.min > this.standarDevRangeOfTwo.low)
}
}, {
name: '二倍标准差',
xAxis: this.standarDevRangeOfTwo.up.toFixed(1),
lineStyle: {
opacity: (this.max < this.standarDevRangeOfTwo
.up) ? 0 : 1
},
label: {
show: !(this.max < this.standarDevRangeOfTwo.up)
}
}, {
name: '三倍标准差',
xAxis: this.standarDevRangeOfThree.low.toFixed(1),
lineStyle: {
opacity: (this.min > this.standarDevRangeOfThree
.low) ? 0 : 1
},
label: {
show: !(this.min > this.standarDevRangeOfThree.low)
}
}, {
name: '三倍标准差',
xAxis: this.standarDevRangeOfThree.up.toFixed(1),
lineStyle: {
opacity: (this.max < this.standarDevRangeOfThree
.up) ? 0 : 1
},
label: {
show: !(this.max < this.standarDevRangeOfThree.up)
}
}, {
name: '平均值',
// type: 'average',
xAxis: this.average.toFixed(1),
lineStyle: {
color: 'red'
}
}, ]
}
}
],
}
chart.setOption(options)
window.addEventListener("resize", () => {
chart.resize()
})
},
}
}
</script>


 5029
5029


 被折叠的 条评论
为什么被折叠?
被折叠的 条评论
为什么被折叠?
 到【灌水乐园】发言


