


在此下载GitHub - pa7/heatmap.js: 🔥 JavaScript Library for HTML5 canvas based heatmaps
我是在es6 class类中使用(其他方法请查看原作者) 导入
const h337 = require("../../public/static/heatmap.js");生成画布
class heatmap {
    //你的经纬度
  latMin = 30.670043;
  latMax = 30.685509;
  lonMin = 104.135339;
  lonMax = 104.160886;
  max = 100;
  width = 600;
  height = 400;
  canvas;
  heat;
  carHeat;
  water;
  constructor(options) {
    this.viewer = options.viewer;
  }
  addHeatMap() {
    //点的个数,你的和我不一样,注意修改
    var len = 19;
    var points = [];
    //和value相关,value等于1的话,为max,则有红点
    let _this = this;
    var dataRaw = [];
    var req = new XMLHttpRequest();
    req.open("get", "heatmap.geojson");
    req.send(null);
    req.onload = function () {
      var data = JSON.parse(req.responseText);
      data.features.forEach((feature) => {
        var point = {
          lat: feature.geometry.coordinates[1],
          lon: feature.geometry.coordinates[0],
           //这里我再geojson中手动添加了coordinates[2],类似于z值
          value: feature.geometry.coordinates[2],
        };
        dataRaw.push(point);
      });
      for (var i = 0; i < len; i++) {
        var dataItem = dataRaw[i];
        var point = {
          x: Math.floor(
            ((dataItem.lon - _this.lonMin) / (_this.lonMax - _this.lonMin)) *
              _this.width
          ),
            //y和原博主不一样,解决偏移问题,方法来自原博主评论区
          y: Math.floor(
            _this.height -
              ((dataItem.lat - _this.latMin) / (_this.latMax - _this.latMin)) *
                _this.height
          ),
          value: Math.floor(dataItem.value),
        };
        _this.max = Math.max(_this.max, dataItem.value);
        points.push(point);
      }

      var heatmapInstance = h337.create({
        container: document.querySelector("#heatmap"),
      });

      var data = {
        max: _this.max,
        data: points,
      };
      //
      heatmapInstance.setData(data);

      _this.viewer._cesiumWidget._creditContainer.style.display = "none";

      _this.canvas = document.getElementsByClassName("heatmap-canvas");
      console.log(_this.canvas);
    };
  }
以entitie形式添加热力图
因为我不想每次都创建画布,所以我分开写,点击按钮时执行移除和添加就行
(会出现问题,创建画布需要时间,若执行完addHeatmap马上执行addHeat会报错,自行解决)
addHeat() {
    this.heat = this.viewer.entities.add({
      name: "heatmap",
      rectangle: {
        coordinates: Cesium.Rectangle.fromDegrees(
          this.lonMin,
          this.latMin,
          this.lonMax,
          this.latMax
        ),
        material: new Cesium.ImageMaterialProperty({
          image: this.canvas[0],
          transparent: true,
        }),
      },
    });
    console.log(this.canvas);
  }
  removeHeat() {
    this.viewer.entities.remove(this.heat);
  }
效果图
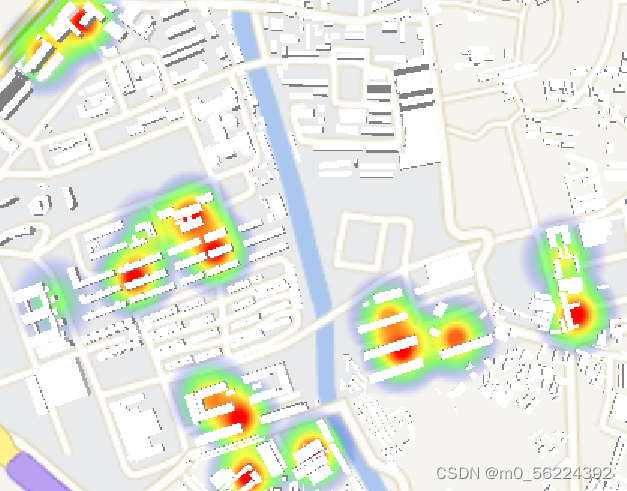
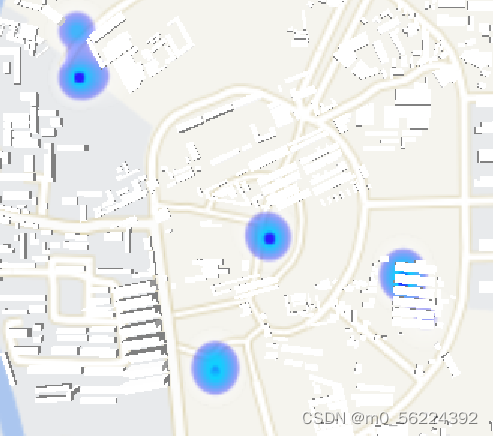
若要实现第二种,需要修改heatmap.js源码

13为半径,下方为颜色
记录遇到的坑,搞了一下午加晚上,先一直出现getcomputedstyle什么的报错,没解决,于是换了一种方法,有同学解决了可以告诉我,谢谢。
在qgis中打的点导出为geojson之后,明明改了坐标系为wgs84(大地坐标),导出后还是笛卡尔坐标,非常气恼,最后把打点的底层图层修改为了wgs84,再创建shp图层,才成功。
最后注意length的问题,注意加一或减一。
本人小白,有错请谅解,有问题尽量解答。


 689
689


 被折叠的 条评论
为什么被折叠?
被折叠的 条评论
为什么被折叠?
 到【灌水乐园】发言


