


在媒体网站中的新闻分类获取最近发布新闻标题,发布时间(格式为2021-02-03 11:12:13 缺失的字段补0),新闻类别(指的是爬取时的分类),新闻来源(指的是爬取是的网站名字)。
获取的标题进行对比,从中提取一定时间范围内出现频率高的热词进行排序,时间范围可自定义,例如24小时内、3天内、7天内、14天内、30天内等。
功能拆分:
1.爬取新闻网站新闻分类的新闻数据
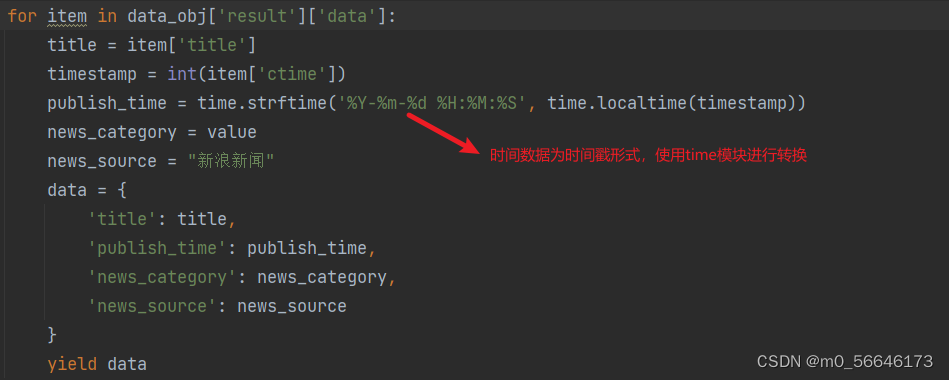
2.数据清洗(时间格式统一,补充描述字段)
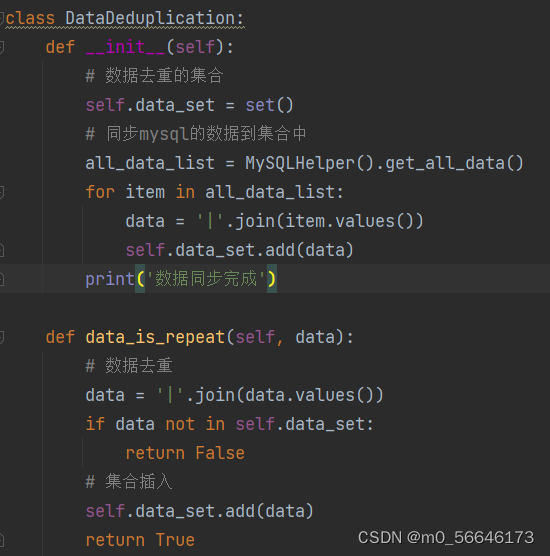
3.数据去重
4.数据持久化,数据入库
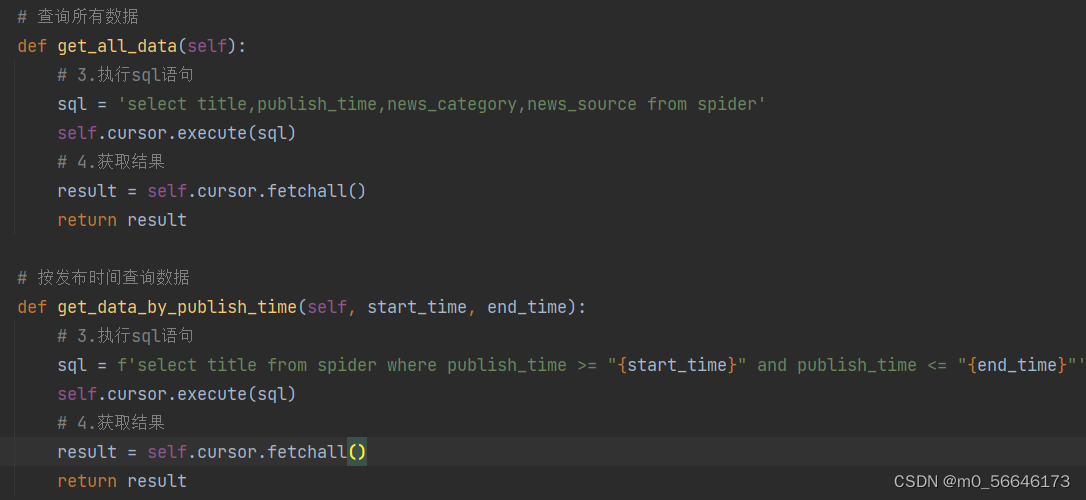
5.按时间段查询数据,查询的数据进行分词,统计,排序
6.搭建web服务器或邮件服务器,对外提供数据
7.对统计分析的数据进行可视化
基本开发环境:
Python 3.11.2
Pycharm
需要设计的技术:
数据库:MySQL
爬虫:requests,xpath,re,
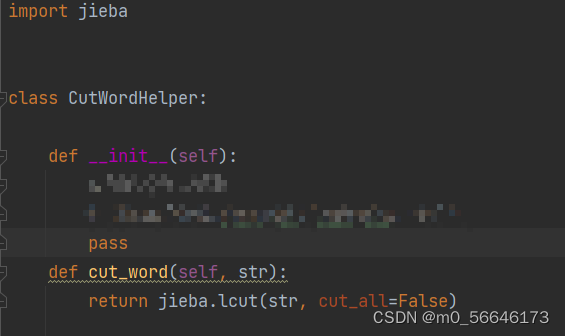
分词:jieba
后端:django
前端:html,css,js,dom,ajax,echarts
语言:python
相关模块 pip install 模块名 安装即可
确定新闻网站

配置django框架
首先使用浏览自带的工具——检查,查找网页新闻标题对应的元素位置
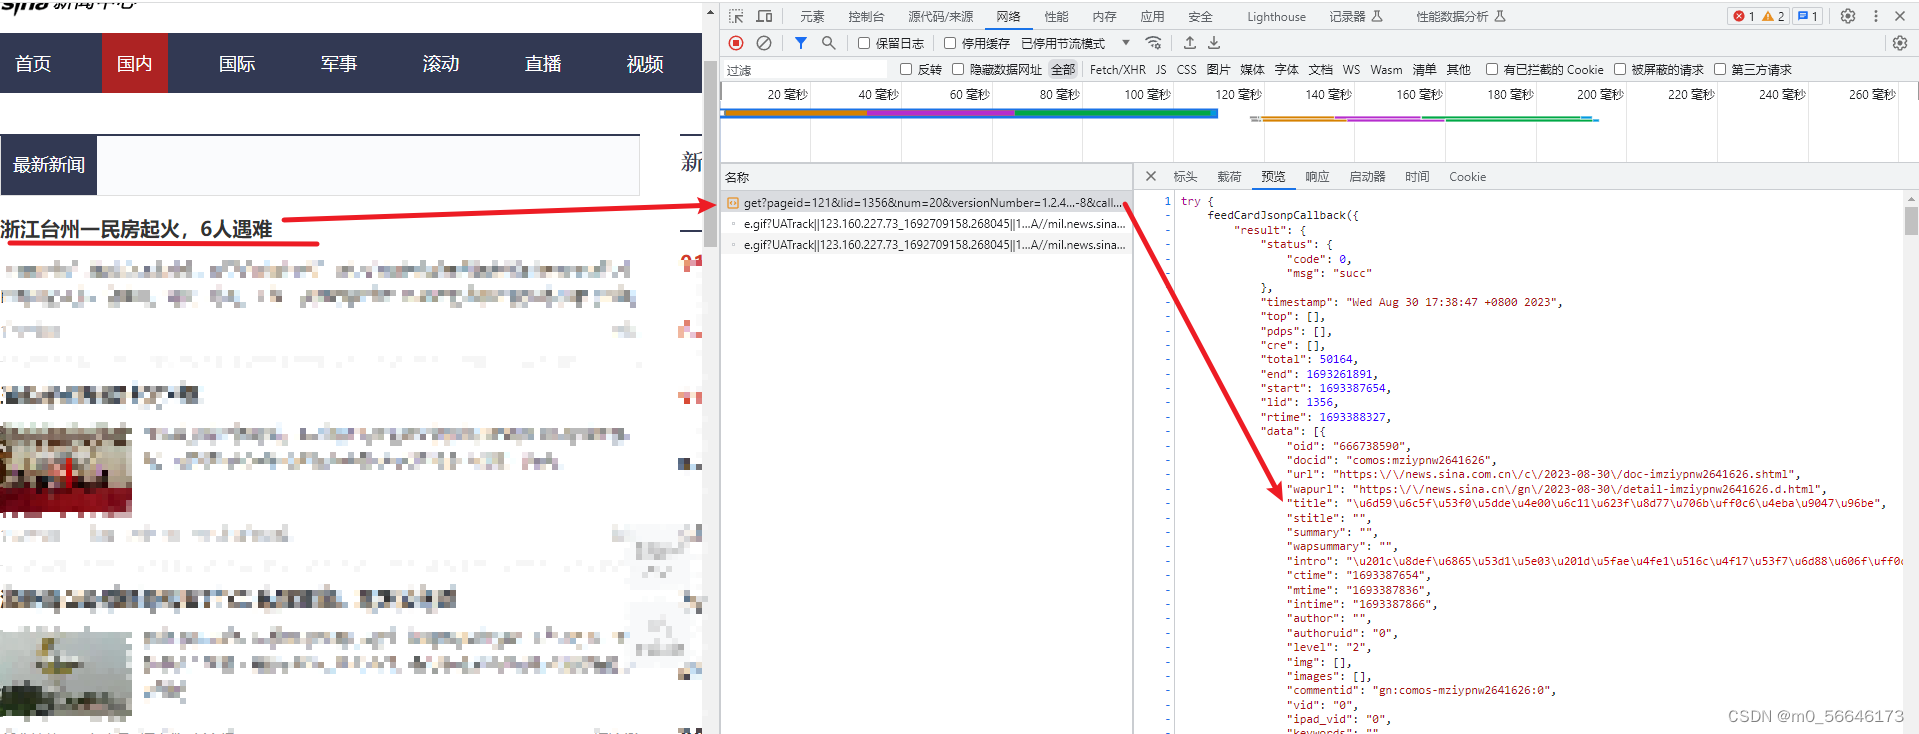
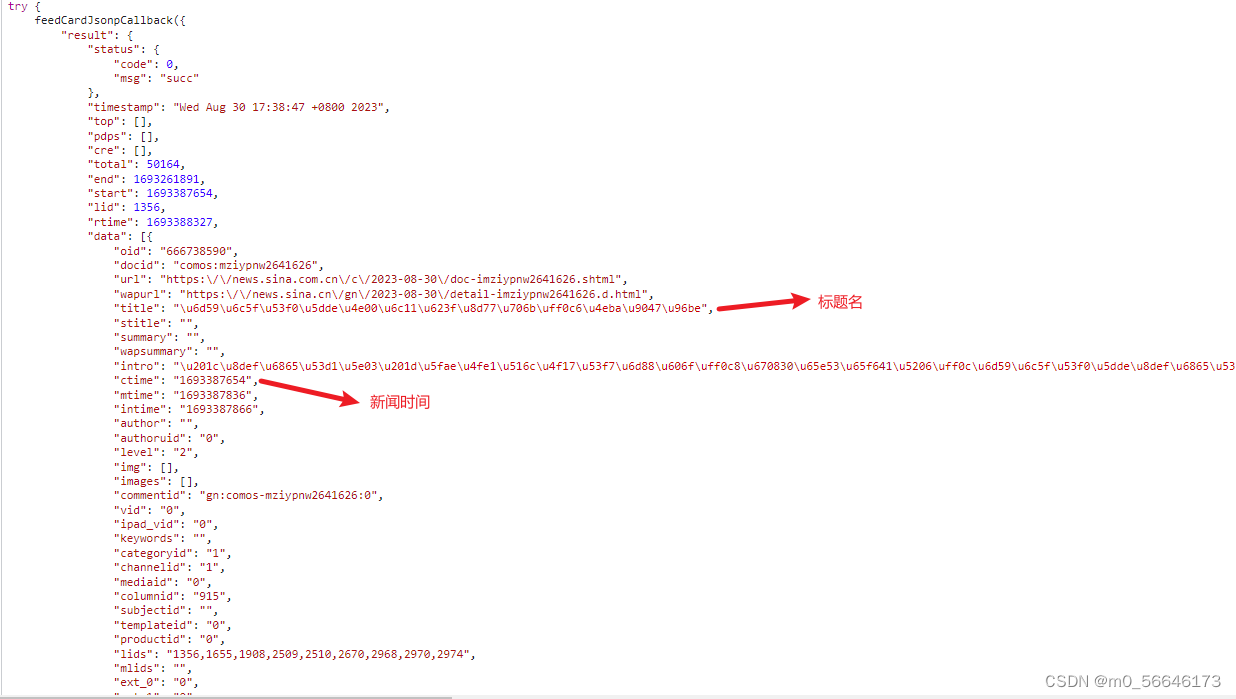
信息都在json文件中,需要解码为UTF-8编码的字符串,需要什么信息在里面找即可。
-
然后使用编辑器编写python代码
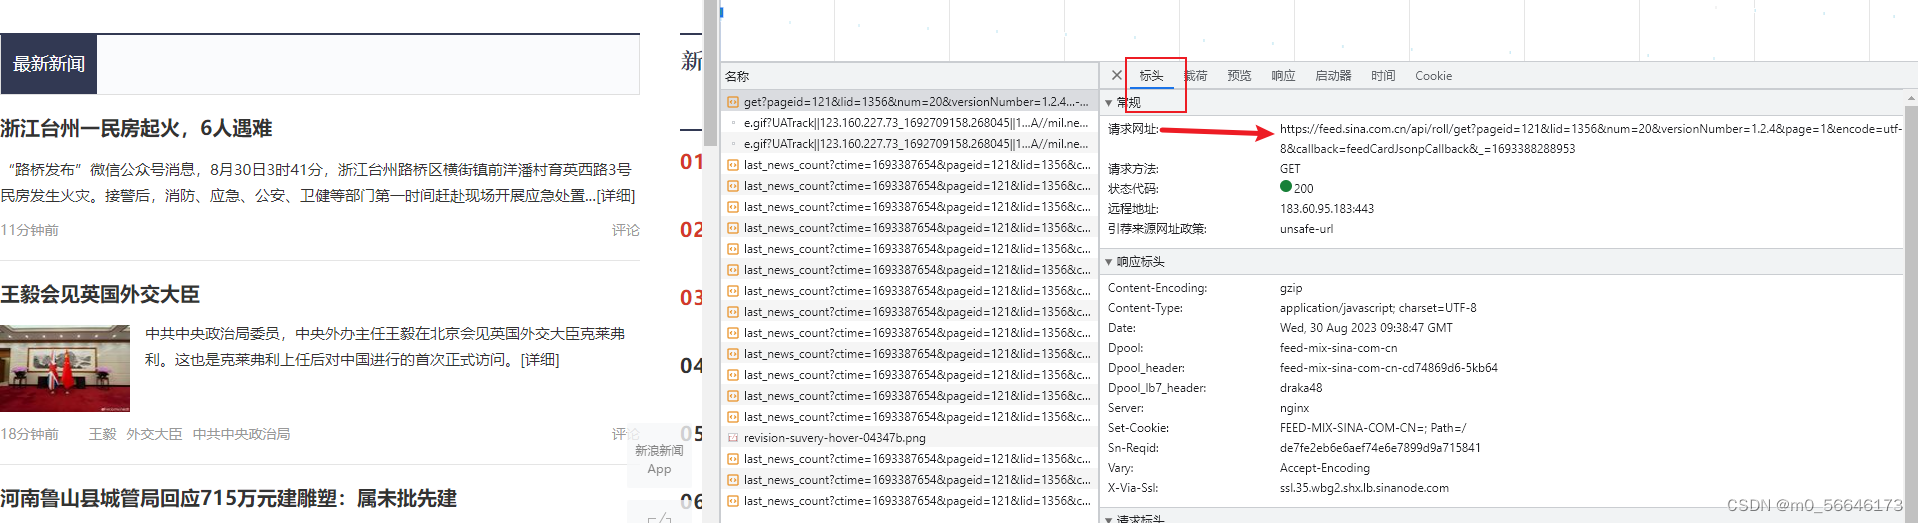
获取请求地址
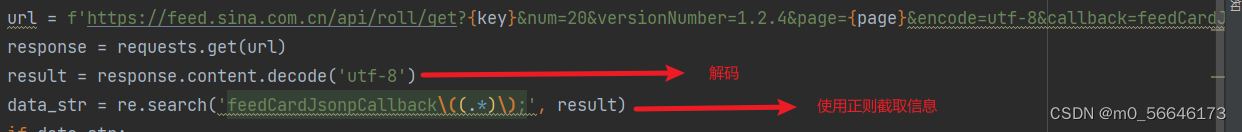
使用requests请求地址并解析:
循环遍历需要的标题和时间:
完整代码:
import requests
import json
import re
import time
class XinLangSpider:
def __init__(self):
self.news_category_dict = {
'pageid=121&lid=1356' : '国内新闻',
'pageid=207&lid=1795' : '科学探索',
'pageid=107&lid=1244' : '明星新闻',
}
def run(self):
for key,value in self.news_category_dict.items():
for page in range(1, 125+1):
url = f'https://feed.sina.com.cn/api/roll/get?{key}&num=20&versionNumber=1.2.4&page={page}&encode=utf-8&callback=feedCardJsonpCallback'
response = requests.get(url)
result = response.content.decode('utf-8')
data_str = re.search('feedCardJsonpCallback\((.*)\);', result)
if data_str:
result = data_str.group(1)
data_obj = json.loads(result)
for item in data_obj['result']['data']:
title = item['title']
timestamp = int(item['ctime'])
publish_time = time.strftime('%Y-%m-%d %H:%M:%S', time.localtime(timestamp))
news_category = value
news_source = "**新闻"
data = {
'title': title,
'publish_time': publish_time,
'news_category': news_category,
'news_source': news_source
}
yield data
if __name__ == '__main__':
xinlang = XinLangSpider()
gen = xinlang.run()
for item in gen:
print(item)
-
数据库存储:
需要的模块
from pymysql import connect
from pymysql.cursors import DictCursor

插入数据:
def insert_data(self, data):
# 执行sql语句
sql = "insert into spider(title,publish_time,news_category,news_source) values(%s,%s,%s,%s)"
self.cursor.execute(sql, (data["title"], data["publish_time"], data["news_category"], data["news_source"]))
# 获取结果
self.mysql_conn.commit()
-
去除重复数据
-
新闻数据分词
这里使用jieba模块,切割新闻标题词
-
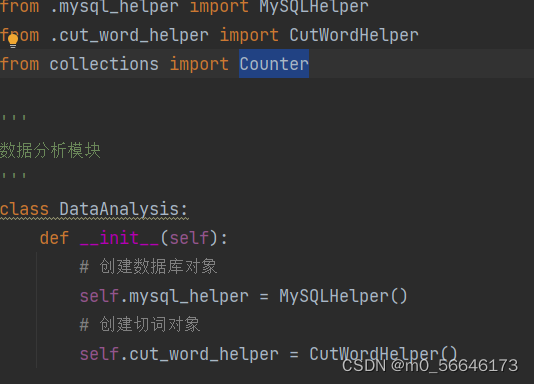
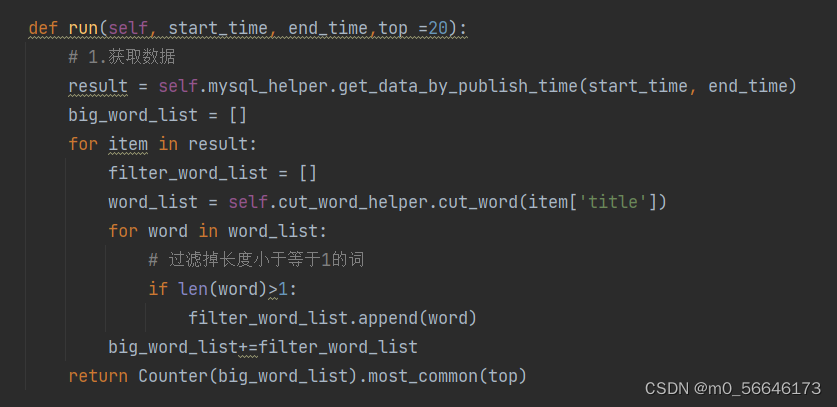
数据分析
这里使用Counter模块进行数据过滤
代码如下:
以上是后端代码。
下面进行对统计分析的数据进行可视化。
这里使用到柱状图框架(网址:https://echarts.apache.org/handbook/zh/basics/download。可翻阅官方文档进行学习)
关键字可视化库(网址:https://github.com/ecomfe/echarts-wordcloud)
代码展示:
<!DOCTYPE html>
<html lang="en">
<head>
<meta charset="UTF-8">
<title>Title</title>
<script src="/static/js/echarts.min.js"></script>
<script src="/static/js/echarts-wordcloud.min.js"></script>
</head>
<body>
<div>
新闻起始时间:
<input id="startTime" type="datetime-local">
</div>
<div>
新闻结束时间:
<input id="endTime" type="datetime-local">
</div>
<div>
Top:
<input id="top" type="number">
</div>
<div>
<button type="button" οnclick="search()">查询</button>
</div>
<script>
function showBar(cut_word_result_list){
let word_arr = []
let count_arr = []
for (let item of cut_word_result_list) {
word_arr.push(item.word);
count_arr.push(item.count);
}
// echarts 数据可视化——柱状图
// 基于准备好的dom,初始化echarts实例
let myChart = echarts.init(document.getElementById('main'));
// 指定图表的配置项和数据
let option = {
title: {
text: '热词统计'
},
tooltip: {},
legend: {
data: ['词频']
},
xAxis: {
data: word_arr
},
yAxis: {},
series: [
{
name: '词频',
type: 'bar',
data: count_arr
}
]
};
// 使用刚指定的配置项和数据显示图表。
myChart.setOption(option);
}
function showVisual(cut_word_result_list) {
let cut_word_data_arr = []
for (let item of cut_word_result_list) {
let word = item.word;
let count = item.count;
let dict = {name: word, value: count};
cut_word_data_arr.push(dict);
}
// echarts 数据可视化——词云图
let chart = echarts.init(document.getElementById('main1'));
chart.setOption({
series: [{
type: 'wordCloud',
shape: 'circle',
keepAspect: false,
left: 'center',
top: 'center',
width: '70%',
height: '80%',
right: null,
bottom: null,
sizeRange: [12, 60],
rotationRange: [-90, 90],
rotationStep: 45,
gridSize: 8,
drawOutOfBound: false,
shrinkToFit: false,
layoutAnimation: true,
textStyle: {
fontFamily: 'sans-serif',
fontWeight: 'bold',
// Color can be a callback function or a color string
color: function () {
// Random color
return 'rgb(' + [
Math.round(Math.random() * 160),
Math.round(Math.random() * 160),
Math.round(Math.random() * 160)
].join(',') + ')';
}
},
emphasis: {
focus: 'self',
textStyle: {
textShadowBlur: 10,
textShadowColor: '#333'
}
},
data: cut_word_data_arr
}]
});
}
function showNews(news_data_list){
let div = document.getElementById('main2');
let templateStr = "";
for (const item of news_data_list){
let title = item.title;
let publish_time = item.publish_time;
let news_category = item.news_category;
let news_source = item.news_source;
templateStr += `<div>${title} -- ${publish_time} -- ${news_category} -- ${news_source}</div>`
}
div.innerHTML = templateStr
}
function search(){
let startTime = document.getElementById("startTime");
let endTime = document.getElementById("endTime");
let top = document.getElementById("top");
startTime = startTime.value.replace("T"," ");
endTime = endTime.value.replace("T"," ");
top = top.value;
var xhr = new XMLHttpRequest();
xhr.open('get',`http://127.0.0.1:8000/data_analysis?start_time=${startTime}&end_time=${endTime}&top=${top}`);
xhr.send();
xhr.onreadystatechange = function () {
if (xhr.readyState == 4 && xhr.status == 200) {
let data = JSON.parse(xhr.responseText);
console.log(data);
showBar(data.cut_word_result_list);
showVisual(data.cut_word_result_list);
showNews(data.news_data_list);
}
}
}
</script>
<div id="main" style="width:1600px;height:400px"></div>
<div id="main1" style="width:800px;height:500px"></div>
<div id="main2"></div>
</body>
</html>
以上是实现爬取网页新闻相关信息的全部功能,有用的话可以关注我,有问题可私信留言交流。


 1560
1560

 被折叠的 条评论
为什么被折叠?
被折叠的 条评论
为什么被折叠?
 到【灌水乐园】发言


