import matplotlib.pyplot as plt
import numpy as np
# 数据
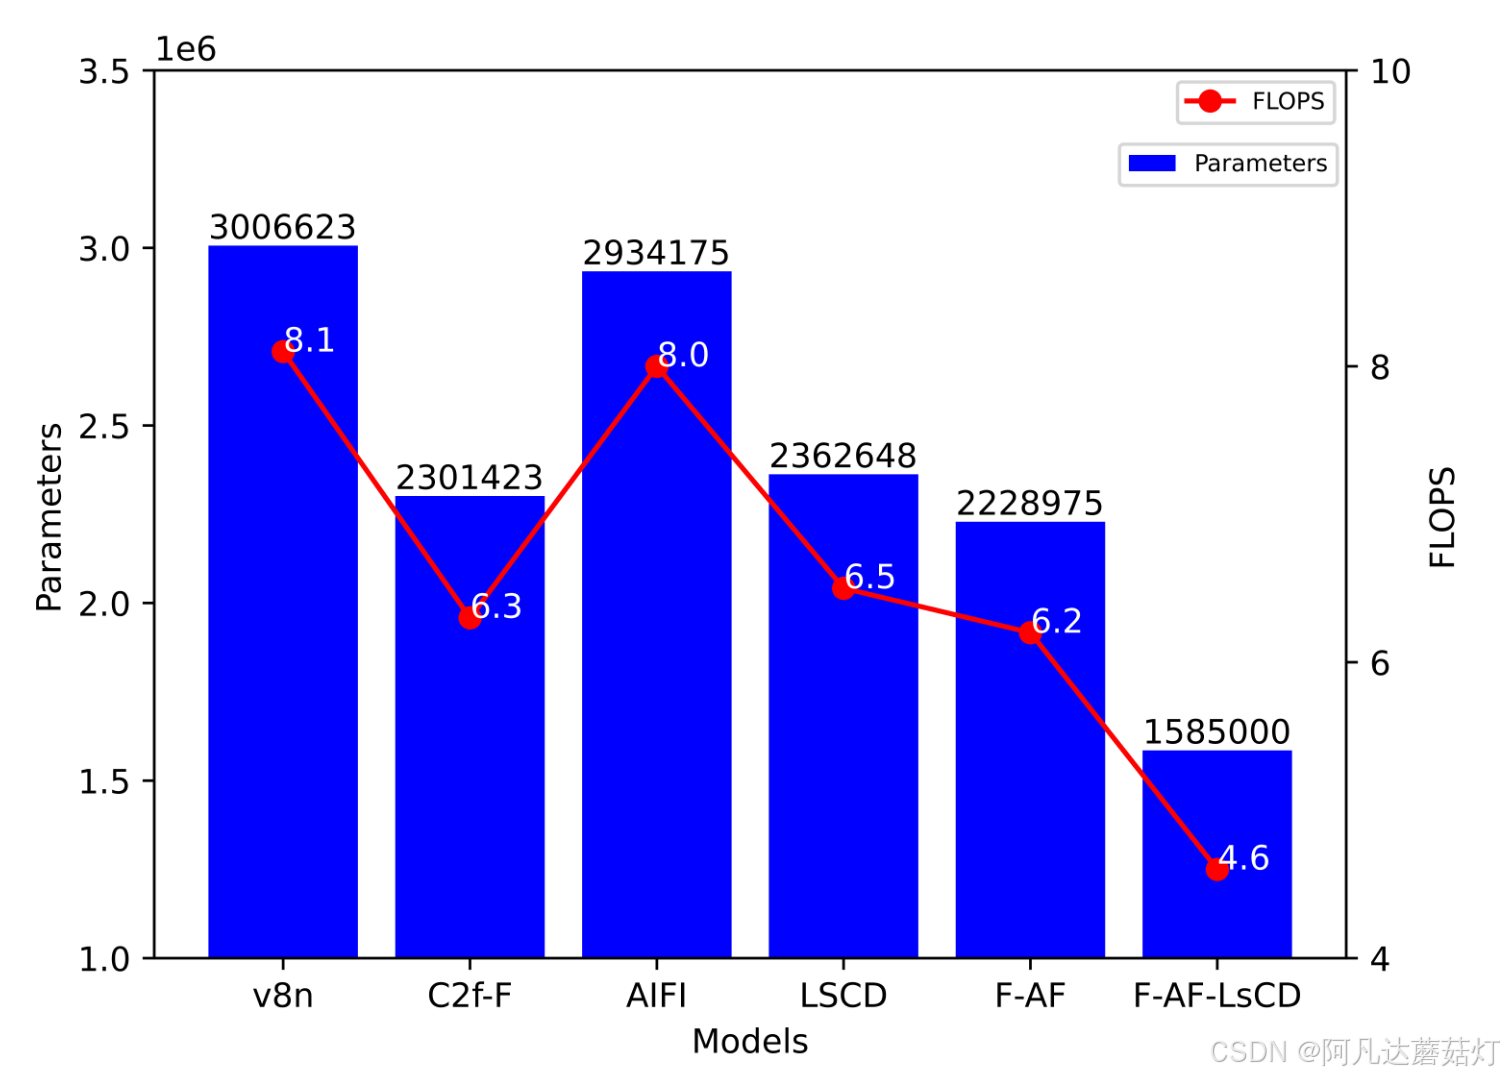
models = ['v8n', 'C2f-F', 'AIFI', 'LSCD', 'F-AF', 'F-AF-LsCD']
params = [3006623, 2301423, 2934175, 2362648, 2228975, 1585000]
flops = [8.1, 6.3, 8.0, 6.5, 6.2, 4.6]
# 创建图形和轴
fig, ax1 = plt.subplots() #figsize=(10,8)
# 绘制柱状图
bars=ax1.bar(models, params, color='blue', label='Parameters',alpha=1)
ax1.set_xlabel('Models')
ax1.set_ylabel('Parameters')
ax1.tick_params(axis='y')
ax1.set_ylim(1.0 * 10**6, 3.5 * 10**6)
#增加数值
for bar in bars:
yval=bar.get_height()
ax1.text(bar.get_x() , yval, round(yval, 2), va='bottom')
# 创建第二个轴用于折线图
ax2 = ax1.twinx()
ax2.plot(models, flops, color='red', marker='o', linestyle='-', label='FLOPS')
ax2.set_ylabel('FLOPS')
ax2.tick_params(axis='y')
ax2.set_ylim(4.5, 8.5)
ax2.set_yticks(np.linspace(4, 10,4))
#增加数值
for i ,txt in enumerate(flops):
ax2.annotate(txt,(models[i],flops[i]),color='white')
# 显示图例
ax1.legend(loc='upper left',fontsize=7,bbox_to_anchor=(0.8, 0.93))
ax2.legend(loc='upper right',fontsize=7,bbox_to_anchor=(1, 1))
# 显示图形
plt.savefig('./models.jpg',dpi=2000)
plt.show()
#D:\Desktop\plt.py


 5988
5988

 被折叠的 条评论
为什么被折叠?
被折叠的 条评论
为什么被折叠?
 到【灌水乐园】发言


