


 超级会员免费看
一、可视化界面美化的作用
GUI可视化界面即图形用户界面,是现代计算设备和系统中不可或缺的一部分。通过优化GUI界面设计,可以显著提升用户体验,使产品更具吸引力。可视化界面美化的主要原则如下:
- 简洁清晰的设计:一个简洁明了的界面设计可以让用户更容易理解和使用产品,减少用户的认知负担,提高操作效率。
- 符合用户习惯:了解并遵循用户的操作习惯,可以使界面更加直观易用,提高用户满意度。
- 和谐的色彩搭配:合理的色彩搭配不仅能够提升界面的美观度,还能影响用户的情绪和感知,从而影响用户体验。
- 响应式设计:适应不同设备和屏幕尺寸的响应式设计,使用户都能获得良好的使用体验。
因此可视化界面美化的作用在于可以提升用户体验并使产品更具吸引力。GUI界面的美化不仅关乎视觉美观,更重要的是它能够显著提升用户体验,增强产品的市场竞争力,是现代产品设计不可或缺的一部分。漂亮的可视化界面可以使人眼前一亮。本文将手把手教您如何打造漂亮的可视化界面。
二、可视化界面美化的方法步骤
Matlab App Desinger界面相对比较朴素,为了提高用户体验,需要采取一些方式对界面进行美化。本文以2D绘图的可视化界面为例,介绍如何进行界面的美化。
1、首先对可视化界面添加背景,如图1可视化界面背景颜色添加所示,在空间属性的颜色中选择颜色自定义,选择对应的颜色。
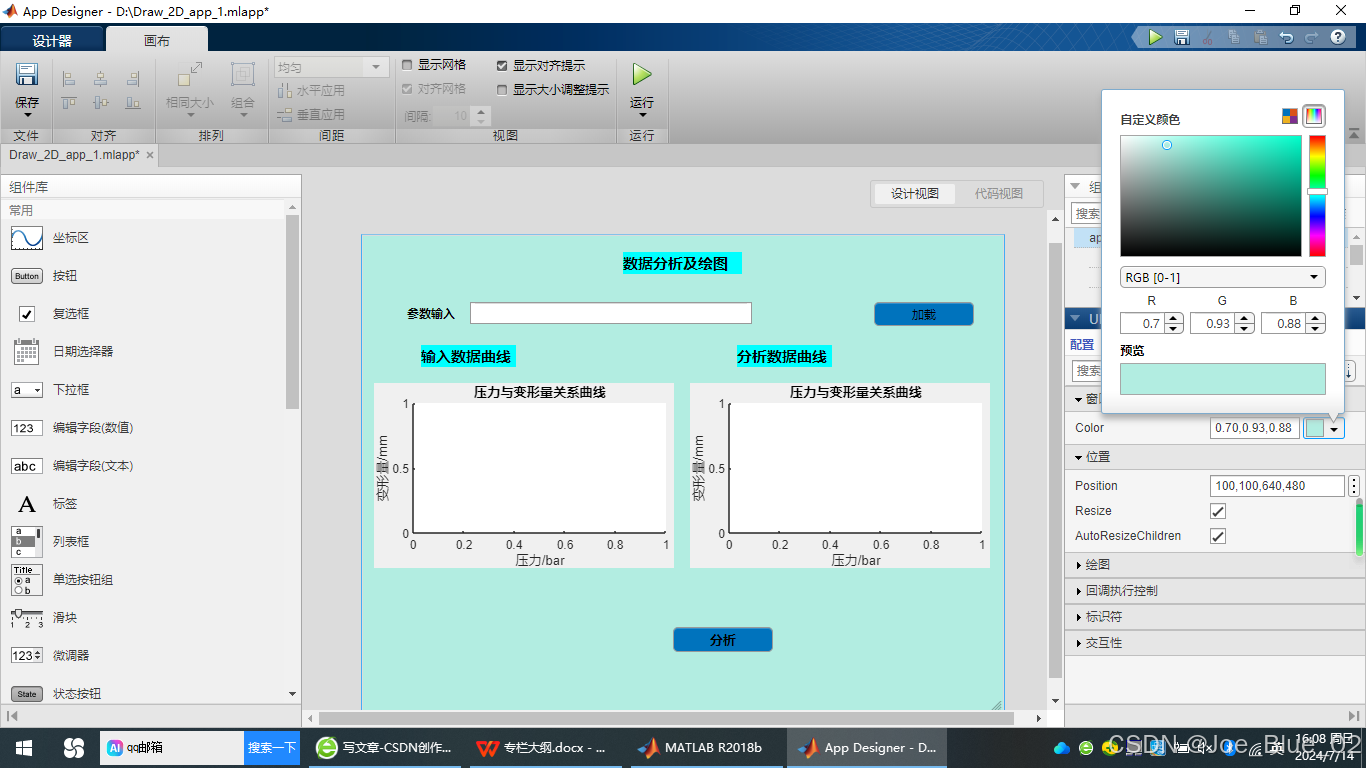
图1可视化界面背景颜色添加
2、数据分析及绘图的标签的背景调整为无颜色,与背景的颜色保持一致,如图2 标签背景及文字属性修改图所示,同时也可以根据需要调整字体类型,字体的颜色以及字体的大小。。
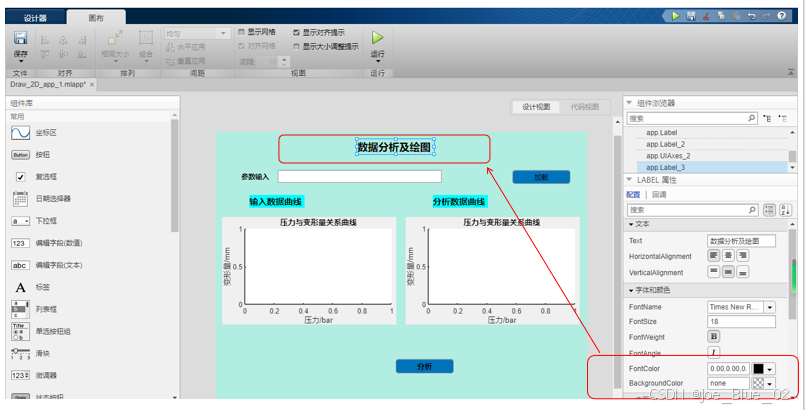
图2 标签背景及文字属性修改
3、同理,输入数据曲线标签和分析数据曲线标签也与界面背景颜色保持一致,如图3输入数据曲线标签和分析数据曲线标签背景颜色修改所示。同理也可以根据需要调整字体类型,字体的颜色以及字体的大小。
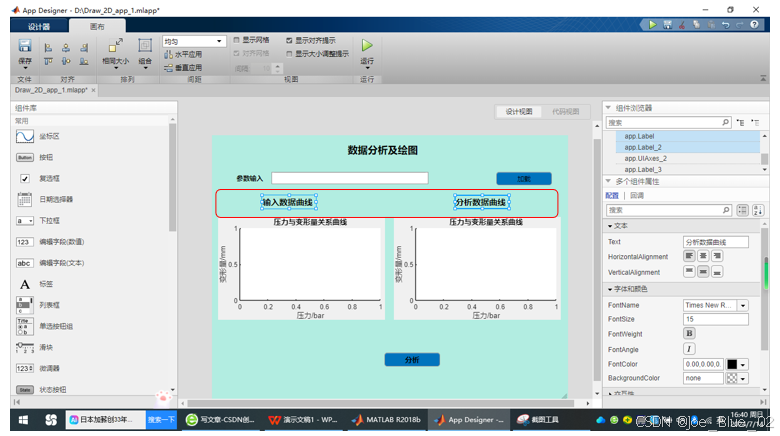
图3 输入数据曲线标签和分析数据曲线标签背景颜色修改
4、对于“加载”Button组件可以在组件属性定义中添加icon自定义图片,来自行对组件进行定义,如图4 组件属性定义中添加icon自定义图片所示。拖动button组件可以调整图标的大小。
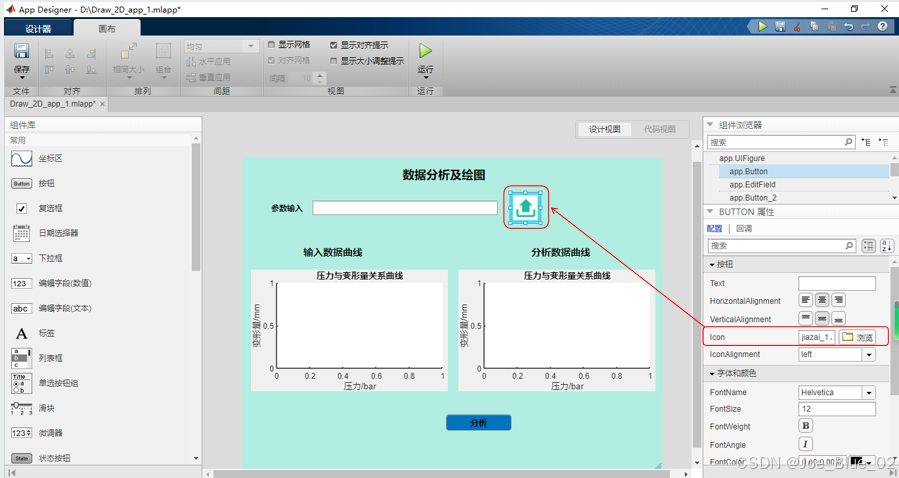
图4 组件属性定义中添加icon自定义图片
5、对坐标区组件的背景颜色进行修改,与背景色保持一致,如图5坐标区组件的背景颜色修改图所示。
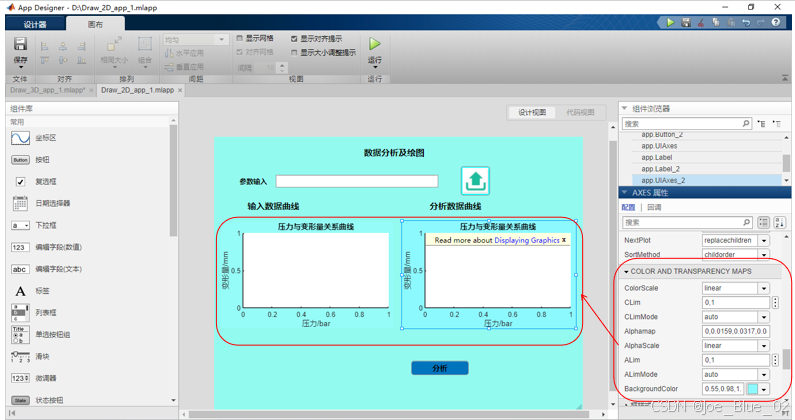
图5 坐标区组件的背景颜色修改
6、对于“分析”Button组件可以在组件属性定义中添加icon自定义图片,来自行对组件进行定义,如图6所示。
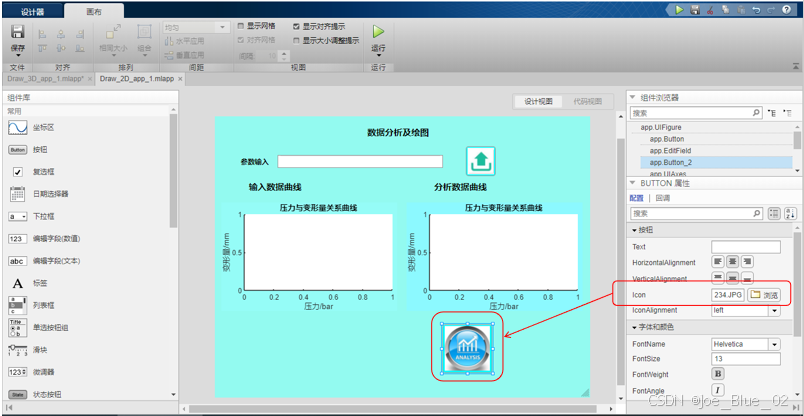
图6 分析按钮组件属性定义中添加icon自定义图片
7、对程序进行运行并加载数据,同时进行分析,界面如下
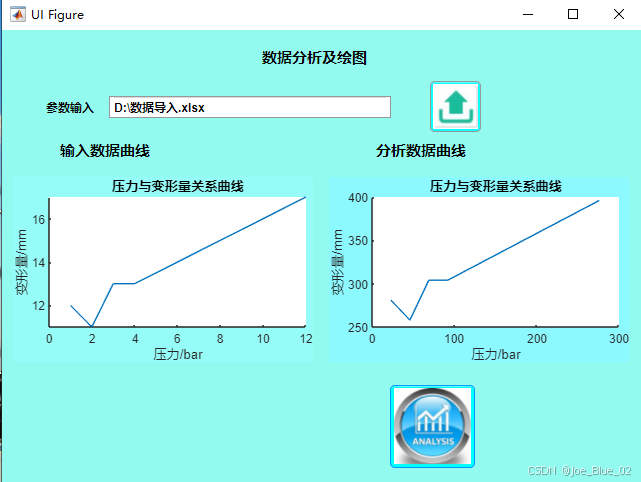
图7 运行时的界面图
8、界面调整之后的完整代码如下
classdef Draw_2D_app_1 < matlab.apps.AppBase

    % Properties that correspond to app components
    properties (Access = public)
        UIFigure        matlab.ui.Figure
        Button          matlab.ui.control.Button
        EditFieldLabel  matlab.ui.control.Label
        EditField       matlab.ui.control.EditField
        Button_2        matlab.ui.control.Button
        UIAxes          matlab.ui.control.UIAxes
        Label           matlab.ui.control.Label
        Label_2         matlab.ui.control.Label
        UIAxes_2        matlab.ui.control.UIAxes
        Label_3         matlab.ui.control.Label
    end

    methods (Access = private)

        % Button pushed function: Button
        function ButtonPushed(app, event)
           clc
           [filename,pathname]=uigetfile({'*.xls';'*.xlsx';'*.*'},'File selector');
           pathname_EditField=string(pathname);
           filename_EditField=string(filename);
           if ~isequal(filename,0)
               app.EditField.Value=fullfile(pathname,filename);
           else
               return
           end
           filename_Ed=app.EditField.Value;
           %Excel中的数据导入,并转化成数组
           pat_1=readtable(filename_Ed,'Sheet',1);
           global P_1
           global S_1
           P_1=table2array(pat_1(:,1));
           S_1=table2array(pat_1(:,2));
           plot(app.UIAxes,P_1,S_1)%在坐标区内进行绘图

        end

        % Button pushed function: Button_2
        function Button_2Pushed(app, event)
           global P_1
           global S_1
           K_1=23;
           P_2=K_1*P_1;
           F_2=K_1*S_1+5;
            plot(app.UIAxes_2,P_2,F_2)%在坐标区内进行绘图
        end
    end

    % App initialization and construction
    methods (Access = private)

        % Create UIFigure and components
        function createComponents(app)

            % Create UIFigure
            app.UIFigure = uifigure;
            app.UIFigure.Color = [0.5765 0.9804 0.9412];
            app.UIFigure.Position = [100 100 640 480];
            app.UIFigure.Name = 'UI Figure';

            % Create Button
            app.Button = uibutton(app.UIFigure, 'push');
            app.Button.ButtonPushedFcn = createCallbackFcn(app, @ButtonPushed, true);
            app.Button.Icon = 'jiazai_1.JPG';
            app.Button.BackgroundColor = [0.0588 1 1];
            app.Button.Position = [429 379 51 51];
            app.Button.Text = '';

            % Create EditFieldLabel
            app.EditFieldLabel = uilabel(app.UIFigure);
            app.EditFieldLabel.HorizontalAlignment = 'right';
            app.EditFieldLabel.FontWeight = 'bold';
            app.EditFieldLabel.Position = [40 393 53 22];
            app.EditFieldLabel.Text = '参数输入';

            % Create EditField
            app.EditField = uieditfield(app.UIFigure, 'text');
            app.EditField.FontWeight = 'bold';
            app.EditField.Position = [108 393 282 22];

            % Create Button_2
            app.Button_2 = uibutton(app.UIFigure, 'push');
            app.Button_2.ButtonPushedFcn = createCallbackFcn(app, @Button_2Pushed, true);
            app.Button_2.Icon = '234.JPG';
            app.Button_2.BackgroundColor = [0 1 1];
            app.Button_2.FontSize = 13;
            app.Button_2.FontWeight = 'bold';
            app.Button_2.Position = [389 43 85 83];
            app.Button_2.Text = '';

            % Create UIAxes
            app.UIAxes = uiaxes(app.UIFigure);
            title(app.UIAxes, '压力与变形量关系曲线')
            xlabel(app.UIAxes, '压力/bar')
            ylabel(app.UIAxes, '变形量/mm')
            app.UIAxes.GridColor = [0.149 0.149 0.149];
            app.UIAxes.BoxStyle = 'full';
            app.UIAxes.TitleFontWeight = 'bold';
            app.UIAxes.BackgroundColor = [0.5843 0.9882 0.9686];
            app.UIAxes.Position = [12 149 300 185];

            % Create Label
            app.Label = uilabel(app.UIFigure);
            app.Label.FontName = 'Times New Roman';
            app.Label.FontSize = 15;
            app.Label.FontWeight = 'bold';
            app.Label.Position = [59 350 95 22];
            app.Label.Text = '输入数据曲线';

            % Create Label_2
            app.Label_2 = uilabel(app.UIFigure);
            app.Label_2.FontName = 'Times New Roman';
            app.Label_2.FontSize = 15;
            app.Label_2.FontWeight = 'bold';
            app.Label_2.Position = [375 350 95 22];
            app.Label_2.Text = '分析数据曲线';

            % Create UIAxes_2
            app.UIAxes_2 = uiaxes(app.UIFigure);
            title(app.UIAxes_2, '压力与变形量关系曲线')
            xlabel(app.UIAxes_2, '压力/bar')
            ylabel(app.UIAxes_2, '变形量/mm')
            app.UIAxes_2.BoxStyle = 'full';
            app.UIAxes_2.TitleFontWeight = 'bold';
            app.UIAxes_2.BackgroundColor = [0.549 0.9765 1];
            app.UIAxes_2.Position = [328 149 300 185];

            % Create Label_3
            app.Label_3 = uilabel(app.UIFigure);
            app.Label_3.FontName = 'Times New Roman';
            app.Label_3.FontSize = 15;
            app.Label_3.FontWeight = 'bold';
            app.Label_3.Position = [261 443 119 22];
            app.Label_3.Text = '数据分析及绘图';
        end
    end

    methods (Access = public)

        % Construct app
        function app = Draw_2D_app_1

            % Create and configure components
            createComponents(app)

            % Register the app with App Designer
            registerApp(app, app.UIFigure)

            if nargout == 0
                clear app
            end
        end

        % Code that executes before app deletion
        function delete(app)

            % Delete UIFigure when app is deleted
            delete(app.UIFigure)
        end
    end
end
三、总结
Matlab 中的App Designer模块可以根据自己的需求对界面进行美化,提升界面的美化度,可视化界面美化的作用在于提升用户体验并使产品更具吸引力。GUI界面的美化不仅关乎视觉美观,更重要的是它能够显著提升用户体验,增强产品的市场竞争力,是现代产品设计不可或缺的一部分。


 2638
2638

 被折叠的 条评论
为什么被折叠?
被折叠的 条评论
为什么被折叠?
 到【灌水乐园】发言


