


一、里面有饼图、折线图(带图片)、柱状图
一、柱状图: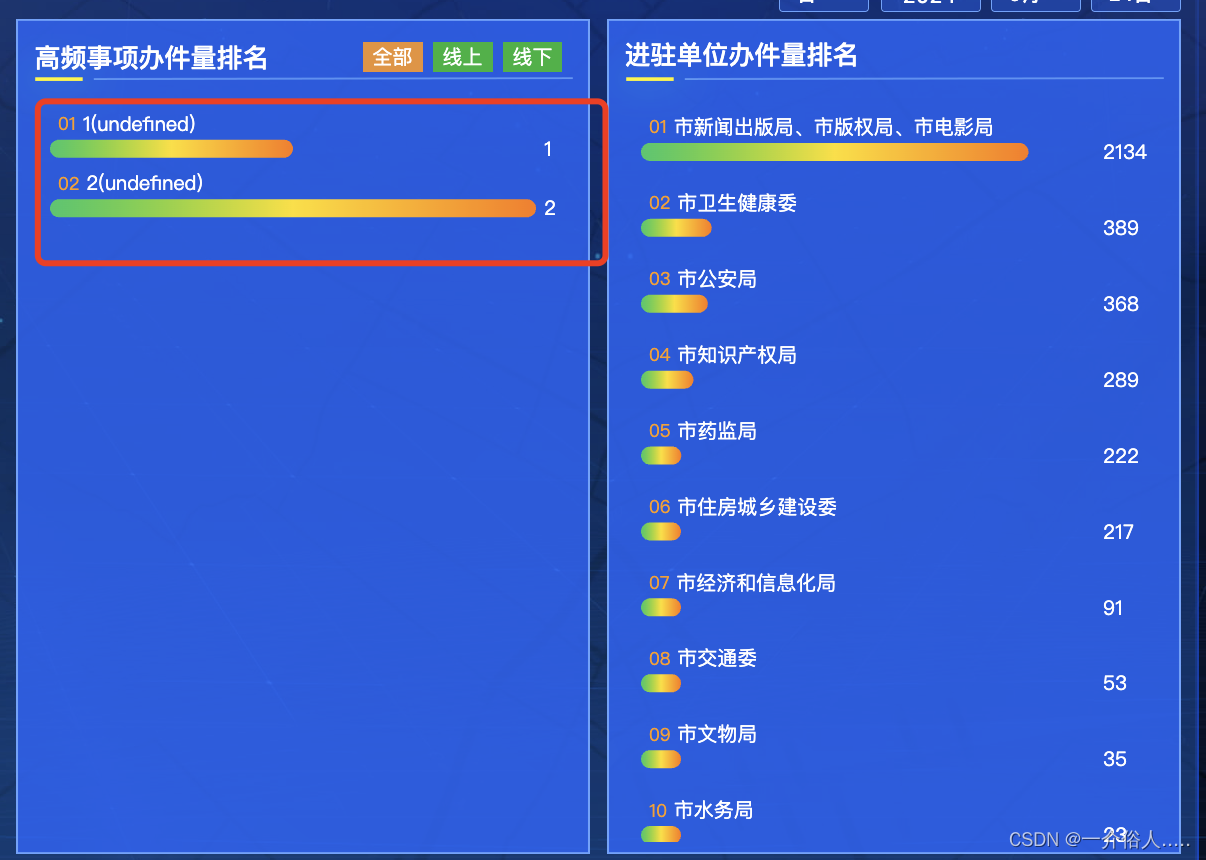
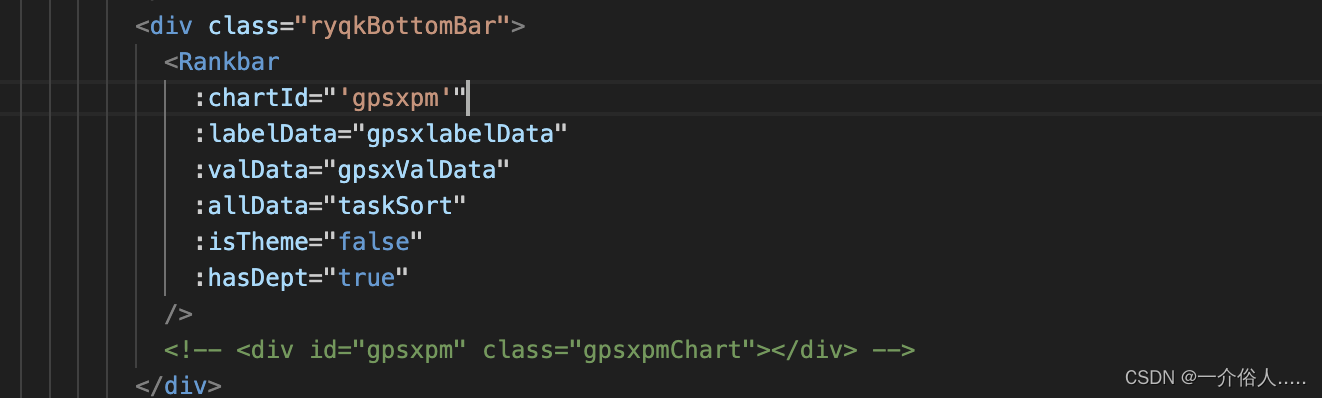
父组件:
  <Rankbar
                    :chartId="'gpsxpm'"
                    :labelData="gpsxlabelData"
                    :valData="gpsxValData"
                    :allData="taskSort"
                    :isTheme="false"
                    :hasDept="true"
                  />

引入子组件:
import { Rankbar, BaseTable } from '@/components/index'
components: {
    Rankbar,

  },


data:
 gpsxValData: [
      {
          name: '333',
          value: '1'
        },
        {
          name: '444',
          value: '2'
        }
      ],
      gpsxlabelData: [
        {
          name: '对方水电费第三方',
          value: '1'
        },
        {
          name: '对方水电费第三方',
          value: '2'
        }
      ],
      taskSort: [
        {
          name: 'DSF',
          value: 1
        },
        {
          name: 'DSF',
          value: 2
        }
      ],


子组件:
<!--
 * @Author: liwenjie lwj@holardata.com
 * @Date: 2023-04-03 10:41:54
 * @LastEditors: liwenjie lwj@holardata.com
 * @LastEditTime: 2023-10-30 10:56:54
 * @FilePath: /src/components/baseRankBar/rankBar.vue
 * @Description: 对外接收五个参数 X轴数据,Y轴数据, chartId 这三个是必传项 (数据排序需要为从小到大,这样显示出来的是从大到小的排序) optionsObj是非必传的配置项 可以覆盖组件内原有的配置项
        !!!!注意:  父组件调用的时候子组件外层的div需要设置overflow:hidden;  否则内容会溢出,滚动条出不来
        示例可以看 /JCFWsys/src/view/overview/index.vue  内容注释掉了
-->
<template>
  <div class="echartBox">
    <div :id="chartId" class="rankBar" ref="rankBar"></div>
  </div>
</template>

<script>
// import otImg from '@/assets/img/gl/6.png'
export default {
  name: 'BaseBares',
  props: {
    chartId: {
      type: String,
      required: true,
      default: 'erBar'
    },
    // y轴数据  系列数据
    labelData: {
      type: Array,
      required: true,
      default: () => {
        return []
      }
    },
    allData: {
      type: Array,
      required: false,
      default: () => {
        return []
      }
    },
    // x轴数据  数值
    valData: {
      type: Array,
      required: true,
      default: () => {
        return []
      }
    },
    // isTheme 事项主题不用传  事项名称传false
    isTheme: {
      type: Boolean,
      required: false,
      default: true
    },
    hasDept: {
      type: Boolean,
      required: false,
      default: false
    },
    optionsObj: {
      type: Object,
      require: false,
      default: () => {}
    }
  },
  watch: {
    valData: {
      handler() {
        // 取最大值作为柱状图背景图长度
        this.max = this.valData.length > 0 ? Math.max.apply(null, this.valData) + 15 : 0
        this.$nextTick(() => {
          this.valData.length > 0 ? this.initBar(this.optionsObj, this.max) : this.chart && this.chart.clear()
        })
      },
      deep: true,
      immediate: true
    },
    labelData: {
      handler(v) {
        this.$nextTick(() => {
          this.valData.length > 0 ? this.initBar(this.optionsObj, this.max) : this.chart && this.chart.clear()
        })
      },
      deep: true
    },
    allData: {
      handler(v) {
        console.log(v, '1111222');
        this.$nextTick(() => {
          this.allData.length > 0 ? this.initBar(this.optionsObj, this.max) : this.chart && this.chart.clear()
        })
      },
      deep: true
    },
    optionsObj: {
      handler() {
        this.$nextTick(() => {
          this.valData.length > 0 ? this.initBar(this.optionsObj, this.max) : this.chart && this.chart.clear()
        })
      },
      deep: true
    },
    isTheme: {
      handler() {
        this.$nextTick(() => {
          this.valData.length > 0 ? this.initBar(this.optionsObj, this.max) : this.chart && this.chart.clear()
        })
      }
    },
    // 监听chart高度  设置cavans高度
    chartH: {
      handler() {
        if (this.chartH > 0) {
          this.$nextTick(() => {
            this.$refs.rankBar.style.height = this.chartH + 'px'
            this.chart && this.chart.resize()
          })
        }
      },
      immediate: true
    }
  },
  computed: {
    // 根据echarts数据长度  计算cavans高度
    chartH() {
      if (this.valData.length > 0) {
        if (this.valData.length == 1) {
          return 70
        } else {
          return this.isTheme ? this.valData.length * 60 : this.valData.length * 80
        }
      } else {
        return 0
      }
    }
  },
  data() {
    return {
      chart: null,
      max: 0,
      themeAxisLabel: {
        width: 180,
        formatter: (value, ind) => {
          let str = ''
          let val = ''
          if (value.length > 6) {
            val = value.substr(0, 6) + '...'
          } else {
            val = value
          }
          if (ind <= 2) {
            str = `{a|${val}}{b|${ind + 1}}`
          } else {
            str = `{a|${val}}{c|${ind + 1}}`
          }
          return str
        },
        rich: {
          a: {
            color: '#fff',
            fontSize: 16,
            width: 115,
            padding: [0, 20, 0, 0]
          },
          b: {
            color: '#FF9C00',
            fontSize: 14,
            align: 'center',
            padding: [2, 2]
          },
          c: {
            color: '#08B6FF',
            fontSize: 14,
            align: 'center',
            padding: [2, 2]
          }
        }
      },
      nameAxisLabel: {
        inside: true,
        color: '#fff',
        fontSize: 20,
        formatter: (value, ind) => {
          let val = ''
          if (value.length > 10) {
            if (this.hasDept) {
              val = value.substr(0, 5) + '...' + '(' + this.allData[ind].deptName + ')'
            } else {
              val = value.substr(0, 20) + '...'
            }
          } else {
            if (this.hasDept) {
              val = value + '(' + this.allData[ind].deptName + ')'
            } else {
              val = value
            }
          }
          if (ind < 9) {
            return `{a|0${ind + 1}} ${val}`
          } else {
            return `{a|${ind + 1}} ${val}`
          }
        },
        rich: {
          a: {
            fontSize: 18,
            color: '#FF9C00'
          }
        },
        verticalAlign: 'bottom',
        padding: [200, 0, 15, 0]
      }
    }
  },
  mounted() {
    this.chart = this.$echarts.init(document.getElementById(this.chartId)) // 初始化echarts实例
    window.addEventListener('resize', () => {
      this.chart && this.chart.resize()
    })
    this.chart &&
      this.chart.on('click', (item) => {
        console.log(item, 'item---');
        this.$emit('selectBarItem', item.data)
      })
  },
  beforeDestroy() {
    this.chart = null
  },
  methods: {
    initBar(options, max) {
      this.chart && this.chart.clear()
      const opt = {
        grid: {
          // 直角坐标系内绘图网格
          left: '',
          top: '21',
          right: '0',
          bottom: '0',
          containLabel: true
        },
        tooltip: {
          show: true,
          confine: true,
          formatter:
            "<div style='display:block;word-break: break-all;word-wrap: break-word;white-space:pre-wrap; font-size: 24px;'>" + '{b}: ' + '{c}</div>'
        },
        xAxis: {
          show: false,
          type: 'value',
          max: max
        },
        yAxis: [
          // 左侧名称数据
          {
            type: 'category',
            axisTick: { show: false },
            axisLine: { show: false },
            inverse: true,
            margin: 15,
            axisLabel: this.isTheme ? this.themeAxisLabel : this.nameAxisLabel,
            // axisLabel: {
            //   align: 'right' // 右对齐
            // },
            data: [...this.labelData]
          },
          // 数值数组当作第二个y轴放在左侧
          {
            type: 'category',
            axisTick: { show: false },
            axisLine: { show: false },
            inverse: true,
            axisLabel: {
              color: '#fff',
              fontSize: 20
            },
            data: [...this.valData]
          }
        ],
        series: [
          // 系列列表。每个系列通过 type 决定自己的图表类型
          {
            type: 'bar', // 柱状、条形图
            barWidth: 18, // 柱条的宽度,默认自适应
            barCategoryGap: 1,
            showBackground: true,
            barMinHeight: 40,
            backgroundStyle: {
              borderRadius: 50,
              color: 'rgba(13,25,64, .6)'
            },
            data: this.allData.length > 0 ? [...this.allData] : [...this.valData], // 系列中数据内容数组
            itemStyle: {
              // 图形样式
              borderRadius: 14, // 柱条圆角半径,单位px.
              barWidth: 18,
              // 也可以分开设置[10,10,10,10]顺时针左上、右上、右下、左下
              color: new this.$echarts.graphic.LinearGradient(0, 0, 1, 0, [
                {
                  offset: 0,
                  color: '#24C768' // 柱图渐变色起点颜色
                },
                {
                  offset: 0.5,
                  color: '#FFDE00' // 柱图渐变色终点颜色
                },
                {
                  offset: 1,
                  color: '#FF7800' // 柱图渐变色终点颜色
                }
              ])
            }
          }
        ]
      }
      Object.assign(opt, options)
      this.chart && this.chart.setOption({ ...opt }, true)
      // 点击
      const that = this
      this.chart.on('click', function (params) {
 最低0.47元/天 解锁文章


06-18
 8533
8533
8533
“相关推荐”对你有帮助么?
-

 非常没帮助
非常没帮助 -

 没帮助
没帮助 -

 一般
一般 -

 有帮助
有帮助 -

 非常有帮助
非常有帮助
提交

 被折叠的 条评论
为什么被折叠?
被折叠的 条评论
为什么被折叠?
 到【灌水乐园】发言


