


1. 引入 npm install mpvue-echarts(注:如果害怕小程序包太大有压力,这一步可以放在别的项目,反正等会也是把里边的文件夹搬运走)
2. ECharts 在线构建 定制 echarts 的 js 文件(需要那些图就下载哪些,我的是只需要折线图,所以我就下载了折线图)
https://echarts.apache.org/zh/builder.html
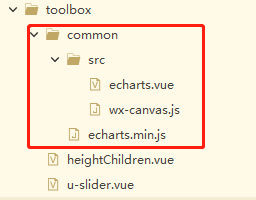
3. 新建 common 文件夹,将定制文件放在 common 下
4. 将 node_modules 下 mpvue-echarts 中 src 文件夹复制到 components 文件夹下,
最终长这样
< 注: 可以直接粘贴我下边的echarts.vue代码、渲染页面代码(heightChildren.vue)、u-slider.vue代码,路径写对,就可以出效果,想看效果的可以直接粘贴>
先看效果图,想要的效果就是拖动上边下边的滑块会跟着变,拖动滑块上边会跟着变,联动效果
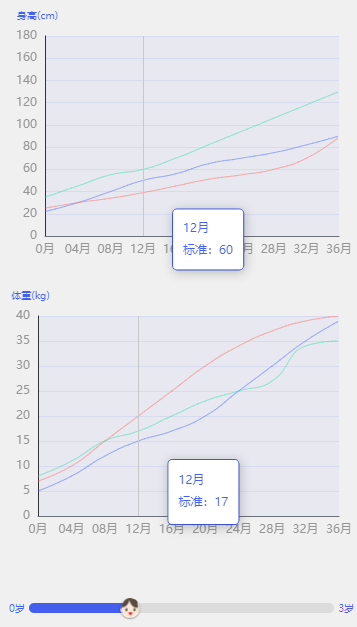
因为 echarts 在uniapp项目中一直出不来效果,所以才选用了在线定制 mpvue-echarts
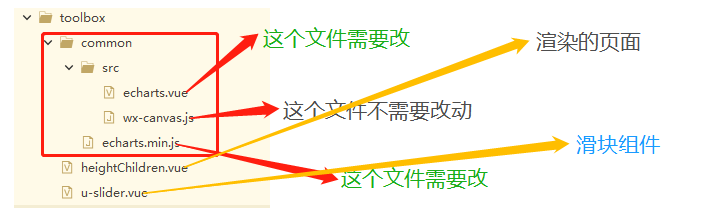
① 再说需要改动的 js 文件, echarts.vue
遇到 this.echarts.setCanvasCreator is not a function 报错
这个错误是由于 prors不能传递方法(之前是可以的,不知道是平台的差异还是版本的差异);
解决办法 将echarts.js 直接导入到echarts.vue 中.
- 引入 import * as echarts from '@/common/echarts.min.js';
- 注销掉 props 中 echarts 对象
- 找到 this.ctx 和 const query ,给其添加 this 参数
this.ctx = wx.createCanvasContext(canvasId,this);
const query = wx.createSelectorQuery().in(this);4. 添加 this.echarts = echarts
echarts.vue 完整代码如下:( 如果怕自己找不完全,可以直接复制,路径改对就可以 )echarts.vue
<template>
	<canvas v-if="canvasId" class="ec-canvas" :id="canvasId + index" :canvasId="canvasId + index"
		@touchstart="touchStart" @touchmove="touchMove" @touchend="touchEnd" @error="error"></canvas>
</template>

<script>
	import WxCanvas from './wx-canvas';
	import * as echarts from '../echarts.min.js';

	export default {
		props: {
			// echarts: {
			//   required: true,
			//   type: Object,
			//   default() {
			//     return echarts;
			//   }
			// },
			value: {
				type: [Number, String]
			},
			index: {
				type: [Number, String]
			},
			option: {

			},
			onInit: {
				required: true,
				type: Function,
				default: null
			},
			canvasId: {
				type: String,
				default: 'ec-canvas'
			},
			lazyLoad: {
				type: Boolean,
				default: false
			},
			disableTouch: {
				type: Boolean,
				default: false
			},
			throttleTouch: {
				type: Boolean,
				default: false
			}
		},
		data(){
			return {
				new_value:null
			}
		},
		watch: {
			value(new_v, old_v) {
				// console.log(new_v, old_v);
				this.new_value = new_v
				// console.log(this.new_value);
				// 拉动下边的滑块数据跟着变
				setTimeout(() => {
					this.chart.dispatchAction({
						type: 'showTip',
						seriesIndex: 2, // 显示第几个series
						dataIndex: this.new_value / 11 // 显示第几个数据
					});
				}, 0)
			}
		},
		onReady() {
			this.echarts = echarts;

			if (!this.echarts) {
				console.warn('组件需绑定 echarts 变量,例:<ec-canvas id="mychart-dom-bar" ' +
					'canvas-id="mychart-bar" :echarts="echarts"></ec-canvas>');
				return;
			}

			//    console.log('echarts');
			// console.log(this.onInit);

			if (!this.lazyLoad) this.init();
		},
		methods: {
			init() {
				console.log(this.new_value);
				const version = wx.version.version.split('.').map(n => parseInt(n, 10));
				const isValid = version[0] > 1 || (version[0] === 1 && version[1] > 9) || (version[0] === 1 && version[
					1] === 9 && version[2] >= 91);
				if (!isValid) {
					console.error('微信基础库版本过低,需大于等于 1.9.91。' + '参见:https://github.com/ecomfe/echarts-for-weixin' +
						'#%E5%BE%AE%E4%BF%A1%E7%89%88%E6%9C%AC%E8%A6%81%E6%B1%82');
					return;
				}

				if (!this.onInit) {
					console.warn('请传入 onInit 函数进行初始化');
					return;
				}

				const canvasId = `${this.canvasId}${this.index}`;
				this.ctx = wx.createCanvasContext(canvasId, this);

				const canvas = new WxCanvas(this.ctx, canvasId);

				this.echarts.setCanvasCreator(() => canvas);

				const query = wx.createSelectorQuery().in(this);
				query
					.select(`#${canvasId}`)
					.boundingClientRect(res => {
						if (!res) {
							//setTimeout(() => this.init(), 200);
							return;
						}
						// 返回值我新加的几个
						this.chart = this.onInit(canvas, res.width, res.height, this.option, this.echarts);
					})
					.exec();
			},
			canvasToTempFilePath(opt) {
				const {
					canvasId
				} = this;
				this.ctx.draw(true, () => {
					wx.canvasToTempFilePath({
						canvasId,
						...opt
					});
				});
			},
			touchStart(e) {
				const {
					disableTouch,
					chart
				} = this;
				if (disableTouch || !chart || !e.mp.touches.length) return;
				const touch = e.mp.touches[0];
				chart._zr.handler.dispatch('mousedown', {
					zrX: touch.x,
					zrY: touch.y
				});
				chart._zr.handler.dispatch('mousemove', {
					zrX: touch.x,
					zrY: touch.y
				});
			},
			touchMove(e) {
				const {
					disableTouch,
					throttleTouch,
					chart,
					lastMoveTime
				} = this;
				if (disableTouch || !chart || !e.mp.touches.length) return;

				if (throttleTouch) {
					const currMoveTime = Date.now();
					if (currMoveTime - lastMoveTime < 240) return;
					this.lastMoveTime = currMoveTime;
				}

				const touch = e.mp.touches[0];
				chart._zr.handler.dispatch('mousemove', {
					zrX: touch.x,
					zrY: touch.y
				});
			},
			touchEnd(e) {
				const {
					disableTouch,
					chart
				} = this;
				if (disableTouch || !chart) return;
				const touch = e.mp.changedTouches ? e.mp.changedTouches[0] : {};
				chart._zr.handler.dispatch('mouseup', {
					zrX: touch.x,
					zrY: touch.y
				});
				chart._zr.handler.dispatch('click', {
					zrX: touch.x,
					zrY: touch.y
				});
			}
		}
	};
</script>

<style scoped>
	.ec-canvas {
		width: 100%;
		height: 100%;
		flex: 1;
	}
</style>
② 先说需要改动的 js 文件, echarts.min.js
遇到 t.addEventListener is not a function 报错
在 common 中找到 echarts.min.js文件
- 全文搜索 use strict 在下面增加语句var isDomLevel2 = (typeof window !== 'undefined') && !!window.addEventListener
- 全文搜索 function Pe(t, e, n, i) 和 function Le(t, e, n, i) 进行修改增加判断,(注意是参数中带有 i 的,Le 与 Pe 函数里内容可能颠倒,在原有方法上增加对应新判断即可)
	function Pe(t, e, n, i) {
		if(isDomLevel2){
			t.addEventListener(e, n, i)
		}else{
			t.attachEvent('on' + e, n)
		}
	}
	function Le(t, e, n, i) {
		if(isDomLevel2){
			t.removeEventListener(e, n, i)
		}else{
			t.detachEvent('on' + e, n)
		}
	}
3.全文搜索 preventDefault() 修改当前的方法函数增加判断(函数名可能不叫 t_,不影响)
t_ = function(t) {
	if(isDomLevel2 ){
		t.preventDefault(), t.stopPropagation(), t.cancelBubble = !0
	}else{
		t.returnValue = false
		t.cancelBubble = !0
	}
},
这个是我的 全部 echearts.min.js 代码,想看效果的话可以直接粘贴用
https://yiben01.oss-cn-hangzhou.aliyuncs.com/apk/zhangshangyouyi/98.99.9.js
,也可以去百度网盘提取
链接: https://pan.baidu.com/s/1qZdBCIYWGMp1YNb-fSrqsg
提取码: jahu
③ 页面渲染 heightChildren.vue代码
<template>
	<view class="pages_height">
		<view class="title">
			<view class="vaccine_title" v-for="(title,title_index) in list1" :key="title_index"
				@click="vaccine_title_click(title_index)">
				<view :class="title_num === title_index ? 'title_fw_big' : 'title_color'">{{title}}</view>
				<view :class="title_num === title_index ? 'line_blue' : ''"></view>
			</view>
		</view>

		<view class="echarts-wrap" @tap="change_value" @touchmove="change_value">
			<mpvue-echarts id="mychart-dom-bar_boy1" canvas-id="mychart-bar_boy1" :echarts="echarts" :onInit="initChart"
				:index="0" :option="option1" v-if="!title_num" :value="value">
			</mpvue-echarts>
			<mpvue-echarts id="mychart-dom-bar_girl1" canvas-id="mychart-bar_girl1" :echarts="echarts"
				:onInit="initChart" :index="0" :option="option1" :value="value" v-else>
			</mpvue-echarts>
		</view>
		<view class="echarts-wrap" @tap="change_value" @touchmove="change_value">
			<mpvue-echarts id="mychart-dom-bar_boy2" canvas-id="mychart-bar_boy2" :echarts="echarts" :onInit="initChart"
				:index="1" :option="option2" :value="value" v-if="!title_num">
			</mpvue-echarts>
			<mpvue-echarts id="mychart-dom-bar_girl2" canvas-id="mychart-bar_girl2" :echarts="echarts"
				:onInit="initChart" :index="1" :value="value" :option="option2" v-else>
			</mpvue-echarts>
		</view>


		<view class="box_slider">
			<view class="start_end_age" :class="title_num? 'girl_zero_age': 'boy_zero_age'">0岁</view>
			<Slider :height="20" v-model="value" :blockColor="title_num?girl:boy" @input="input_slider"
				:activeColor="title_num?'#FF5F5F':'#445FED'"></Slider>
			<view class="start_end_age" :class="title_num? 'girl_three_age': 'boy_three_age'">3岁</view>
		</view>
	</view>
</template>

<script>
	import Slider from './u-slider';
	import * as echarts from './common/echarts.min.js';
	import mpvueEcharts from './common/src/echarts.vue';
	let chart_arr1 = []
	let chart_arr2 = []
	// let chart_X = 3
	export default {
		components: {
			Slider,
			mpvueEcharts
		},
		data() {
			return {
				list1: ['男孩', '女孩'],
				title_num: 0,
				value: 11 * (uni.getStorageSync("chart_X").toString() ? uni.getStorageSync("chart_X") : 3),
				chart_arr: [],
				girl: 'url(https://yiben01.oss-cn-hangzhou.aliyuncs.com/img/d959e45e90baeddcf52d38ba50f5a4d003b2d516_143.png) center/100% 100% no-repeat',
				boy: 'url(https://yiben01.oss-cn-hangzhou.aliyuncs.com/img/c5f080bdcbea8a6147e074099d25d11cd2d150c2_120.png) center/100% 100% no-repeat',
				echarts,
				option1: {},
				option2: {},
			}
		},
		mounted() {

		},
		onHide() {
			uni.removeStorageSync("chart_X")
		},
		onUnload() {
			uni.removeStorageSync("chart_X")
		},
		created() {
			this.option_data()
		},


		methods: {
			change_value() {
				setTimeout(() => {
					// console.log(uni.getStorageSync("chart_X"));
					this.value = 11 * (uni.getStorageSync("chart_X").toString() ? uni.getStorageSync("chart_X") :
						3);
				}, 0)
			},
			vaccine_title_click(index) {
				this.title_num = index;
				uni.removeStorageSync("chart_X")
				this.value = 33;
				this.option_data()
			},
            // 滑块获取value值
			input_slider(value) {
				this.value = value.detail.__args__[0];			},

			option_data() {
				this.option1 = {
					// animation: false,
					tooltip: {
						trigger: 'axis',
						axisPointer: {
							lineStyle: {
								color: '#C8C8C8', //显示竖线颜色
								type: 'solid'

							}
						},
						backgroundColor: '#FFFFFF', //tooltip背景色
						borderColor: this.title_num ? '#FF5F5F' : '#445FED', //tooltip边框颜色
						borderWidth: 0.5,
						textStyle: {
							color: this.title_num ? '#FF5F5F' : '#445FED',
							fontSize: 10,
							fontWeight: 'bolder',
							width: 100,
						},
						extraCssText: 'width:205rpx;height: 105rpx; white-space:pre-wrap;border-radius: 10rpx;', //额外附加到浮层的 css 样式 ;white-space:pre-wrap的作用是保留空格,并且除了碰到源码中的换行和<br/>会换行外,还会自适应容器的边界进行换行。
						// 自定义悬浮提示框内容
						formatter(params) { // params的个数等于折线的条数
							return `${params[2].name}\n标准:${params[2].data}`
						}
					},
					grid: {
						top: 45,
						left: 15,
						right: 15,
						height: 220,
						bottom: 0,
						containLabel: true,
						show: true,
						borderColor: "transparent",
						backgroundColor: this.title_num ? 'rgba(255,95,95,0.05)' : 'rgba(68,95,237,0.05)',
					},
					xAxis: {
						type: 'category',
						boundaryGap: false, // 不从原点开始
						// y轴刻度线
						axisTick: {
							show: false
						},
						axisPointer: {
							value: '12月',
							snap: true,
							handle: {
								show: true,
								color: '#7581BD',
								size: [20, 20],
								margin: 100,
								// icon: 'image://https://yiben01.oss-cn-hangzhou.aliyuncs.com/img/d959e45e90baeddcf52d38ba50f5a4d003b2d516_143.png'
							}
						},
						axisLabel: {
							show: true,
							interval: 0,
							textStyle: {
								color: '#969696', //更改坐标轴文字颜色
								fontSize: 12 //更改坐标轴文字大小
							},
							showMaxLabel: true,
						},
						data: ['0月', '04月', '08月', '12月', '16月', '20月', '24月', '28月', '32月', '36月'],
					},
					yAxis: {
						name: '身高(cm)',
						nameTextStyle: {
							color: this.title_num ? '#FF5F5F' : '#445FED',
							fontSize: 10,
							padding: [0, 0, 0, -15]
						},
						nameLocation: "end", // y轴name处于x轴的什么位置

						type: 'value',
						scale: true,
						min: 0,
						max: 180,
						interval: 20,

						// 背景线
						splitLine: {
							show: true,
							lineStyle: {
								color: 'rgba(68,95,237,0.1)',
							}
						},
						axisLine: {
							show: true,
							lineStyle: {
								color: '#323232',
							}
						},
						axisLabel: {
							show: true,
							textStyle: {
								color: '#969696', //更改坐标轴文字颜色
								fontSize: 12 //更改坐标轴文字大小
							},
							showMaxLabel: true,
						}
					},
					series: [{
							name: '当日新增',
							type: 'line',
							smooth: true,
							symbol: 'none', //取消折点圆圈
							data: [22, 30, 40, 50, 56, 65, 70, 75, 82, 90],
							itemStyle: {
								normal: {
									color: "#445FED", //折线点的颜色
									lineStyle: {
										color: "#445FED", //折线的颜色
										width: 0.5 // 0.1的线条是非常细的了
									}
								}
							},
						},
						{
							name: '当日复诊',
							type: 'line',
							smooth: true,
							symbol: 'none', //取消折点圆圈
							data: [25, 30, 34, 39, 45, 51, 55, 60, 70, 89],
							itemStyle: {
								normal: {
									color: "#FF5F5F", //折线点的颜色
									lineStyle: {
										color: "#FF5F5F", //折线的颜色
										width: 0.5 // 0.1的线条是非常细的了
									}
								}
							},
						},
						{
							name: '当日复诊',
							type: 'line',
							smooth: true,
							symbol: 'none', //取消折点圆圈
							data: [35, 45, 55, 60, 70, 82, 94, 106, 118, 130],
							itemStyle: {
								normal: {
									color: "#2DC8A0", //折线点的颜色
									lineStyle: {
										color: "#2DC8A0", //折线的颜色
										width: 0.5 // 0.1的线条是非常细的了
									}
								}
							},
						},
					]

				}
				this.option2 = {
					// animation: false,
					tooltip: {
						trigger: 'axis',
						axisPointer: {
							lineStyle: {
								color: '#C8C8C8', //显示竖线颜色
								type: 'solid',
							}
						},
						padding: 10,
						backgroundColor: '#FFFFFF', //tooltip背景色
						borderColor: this.title_num ? '#FF5F5F' : '#445FED', //tooltip边框颜色
						borderWidth: 0.5,
						textStyle: {
							color: this.title_num ? '#FF5F5F' : '#445FED',
							fontSize: 10,
							fontWeight: 'bolder',
							width: 100,
						},
						extraCssText: 'width:205rpx;height: 105rpx; white-space:pre-wrap;border-radius: 10rpx;', //额外附加到浮层的 css 样式 ;white-space:pre-wrap的作用是保留空格,并且除了碰到源码中的换行和<br/>会换行外,还会自适应容器的边界进行换行。
						// 自定义悬浮提示框内容,在这里不起效,原因不知道,所以写在下边的函数中,手动添加
						formatter(params) { // params的个数等于折线的条数
							return `${params[2].name}\n标准:${params[2].data}`
						}
					},
					grid: {
						top: 25,
						left: 15,
						right: 15,
						height: 220,
						bottom: 0,
						containLabel: true,
						show: true, //是否显示直角坐标系网格。
						borderColor: "transparent",
						backgroundColor: this.title_num ? 'rgba(255,95,95,0.05)' : 'rgba(68,95,237,0.05)',
					},
					xAxis: {
						type: 'category',
						axisPointer: {
							value: '12月',
							snap: true,
							handle: {
								show: true,
								color: '#7581BD',
								size: [20, 20],
								margin: 100,
							}
						},
						boundaryGap: false, // 不从原点开始
						// y轴刻度线
						axisTick: {
							show: false
						},
						axisLabel: {
							show: true,
							interval: 0,
							textStyle: {
								color: '#969696', //更改坐标轴文字颜色
								fontSize: 12 //更改坐标轴文字大小
							},
							showMaxLabel: true,
						},
						data: ['0月', '04月', '08月', '12月', '16月', '20月', '24月', '28月', '32月', '36月'],
					},
					yAxis: {
						name: '体重(kg)',
						nameTextStyle: {
							color: this.title_num ? '#FF5F5F' : '#445FED',
							fontSize: 10,
							padding: [0, 0, 0, -15]
						},
						nameLocation: "end", // y轴name处于x轴的什么位置

						type: 'value',
						scale: true,
						min: 0,
						max: 40,
						interval: 5,

						// 背景线
						splitLine: {
							show: true,
							lineStyle: {
								color: 'rgba(68,95,237,0.1)',
							}
						},
						axisLine: {
							show: true,
							lineStyle: {
								color: '#323232',
							}
						},
						axisLabel: {
							show: true,
							textStyle: {
								color: '#969696', //更改坐标轴文字颜色
								fontSize: 12 //更改坐标轴文字大小
							},
							showMaxLabel: true,
						}
					},
					series: [{
							name: '当日新增患者',
							type: 'line',
							smooth: true,
							symbol: 'none', //取消折点圆圈
							data: [5, 8, 12, 15, 17, 20, 25, 30, 35, 39],
							itemStyle: {
								normal: {
									color: "#445FED", //折线点的颜色
									lineStyle: {
										color: "#445FED", //折线的颜色
										width: 0.5 // 0.1的线条是非常细的了
									}
								}
							},
						},
						{
							name: '当日复诊患者',
							type: 'line',
							smooth: true,
							symbol: 'none', //取消折点圆圈
							data: [7, 10, 15, 20, 25, 30, 34, 37, 39, 40],
							itemStyle: {
								normal: {
									color: "#FF5F5F", //折线点的颜色
									lineStyle: {
										color: "#FF5F5F", //折线的颜色
										width: 0.5 // 0.1的线条是非常细的了
									}
								}
							},

							markLine: {
								itemStyle: { //盒须图样式。
								},
								name: 'cc',
								//yAxisIndex: 0,
								// symbol:'none',//去掉箭头
								data: [
									[{
											coord: ['12月', 17]
										},
										// {
										// 	coord: ['x轴坐标', y轴值]
										// }
									]
								]
							},
						},
						{
							name: '当日复诊患者',
							type: 'line',
							smooth: true,
							symbol: 'none', //取消折点圆圈
							data: [8, 11, 15, 17, 20, 23, 25, 27, 34, 35],
							itemStyle: {
								normal: {
									color: "#2DC8A0", //折线点的颜色
									lineStyle: {
										color: "#2DC8A0", //折线的颜色
										width: 0.5 // 0.1的线条是非常细的了
									}
								}
							},
						},
					]
				}
			},

			// 折线图
			initChart(canvas, width, height, option, echarts_all, change_value) {
				// console.log(canvas, width, height, option, echarts_all,change_value);
				let chart = null
				chart = echarts.init(canvas, null, {
					width: width,
					height: height
				});

				// 提示框内容
				option.tooltip.formatter = params => {
					// console.log('我是formatter函数', params)
					return `${params[2].name}\n标准:${params[2].data}`
				}

				chart.setOption(option);

				// // 初始化,一进来就有提示框
				setTimeout(() => {
					chart.dispatchAction({
						type: 'showTip',
						seriesIndex: 2, // 显示第几个series
						dataIndex: 3 // 显示第几个数据
					});
				}, 0)

                // 为了将所有的表格拿到并合并到一个数组,达到多表联动
				if (uni.getStorageSync('c_chart')) {
					chart_arr2.push(chart)
					uni.removeStorageSync('c_chart')
				} else {
					uni.setStorageSync('c_chart', true);
					chart_arr1.push(chart)
				}
				if (chart_arr1.length && chart_arr2.length) {
					// 多表联动
					echarts_all.connect([...chart_arr1, ...chart_arr2]);
					uni.removeStorageSync("c_chart")
				}

				//点击x轴线
				chart.getZr().on('click', params => {
					const pointInPixel = [params.offsetX, params.offsetY]
					if (chart.containPixel('grid', pointInPixel)) {
						const xIndex = chart.convertFromPixel({
							seriesIndex: 0
						}, [params.offsetX, params.offsetY])[0]
						// console.log(xIndex)
                        // 为了达到折线图滑动,滑块跟着滑动,实现value值跟着变
						uni.setStorageSync("chart_X", xIndex)
						// chart_X = xIndex
						// let time = option.xAxis.data[xIndex] //x轴的数值
						// console.log(time)
					}
				})
				// 滑动x轴线
				chart.getZr().on('mousemove', params => {
					const pointInPixel = [params.offsetX, params.offsetY]
					if (chart.containPixel('grid', pointInPixel)) {
						let xIndex = chart.convertFromPixel({
							seriesIndex: 0
						}, [params.offsetX, params.offsetY])[0]
						uni.setStorageSync("chart_X", xIndex)
					}
				})

				return chart;
			},
		}
	}
</script>

<style scoped>
	.pages_height {
		width: 100%;
		color: #191919;
		background: #F0F0F0;
		min-height: 100vh;
	}

	.title {
		display: flex;
		justify-content: space-around;
		align-items: center;
		height: 80rpx;
		background: #F7F7F7;
	}

	.vaccine_title {
		display: flex;
		align-items: center;
		flex-direction: column;
		padding: 12rpx 20rpx;
	}

	.title_color {
		font-size: 24rpx;
		font-family: PingFangSC-Regular, PingFang SC;
		font-weight: 300;
		color: #969696;
	}

	.title_fw_big {
		font-size: 30rpx;
		font-family: PingFangSC-Medium, PingFang SC;
		font-weight: bold;
		color: #191919;
	}

	.line_blue {
		width: 60rpx;
		height: 10rpx;
		background: #445FED;
	}

	.box_slider {
		margin-top: 25rpx;
		padding-bottom: 20rpx;
		height: 50rpx;
		position: relative;
	}

	.start_end_age {
		font-size: 20rpx;
		font-family: PingFangSC-Regular, PingFang SC;
	}

	.boy_zero_age {
		color: #445FED;
		position: absolute;
		left: 30rpx;
		top: -4rpx;
	}

	.boy_three_age {
		color: #445FED;
		position: absolute;
		right: 30rpx;
		top: -4rpx;
	}

	.girl_zero_age {
		color: #FF5F5F;
		position: absolute;
		left: 30rpx;
		top: -4rpx;
	}

	.girl_three_age {
		color: #FF5F5F;
		position: absolute;
		right: 30rpx;
		top: -4rpx;
	}

	.echarts-wrap {
		width: 100%;
		height: 600rpx;
		box-sizing: border-box;
		padding: 0 30rpx 0 15rpx;
	}
</style>
④ u-slider组件代码, u-slider.vue
<template>
	<view class="u-slider" @tap="onClick" :class="[disabled ? 'u-slider--disabled' : '']" :style="{
			backgroundColor: inactiveColor
		}">
		<view class="u-slider__gap" :style="[
					barStyle,
					{
						height: height + 'rpx',
						backgroundColor: activeColor
					}
				]">
			<view class="u-slider__button-wrap" @touchstart="onTouchStart" @touchmove="onTouchMove"
				@touchend="onTouchEnd" @touchcancel="onTouchEnd">
				<slot v-if="$slots.default  || $slots.$default" />
				<view v-else class="u-slider__button" :style="[blockStyle, {
						height: blockWidth + 'rpx',
						width: blockWidth + 'rpx',
						background: blockColor,
					}]"></view>
			</view>
		</view>
	</view>

</template>

<script>
	export default {
		name: 'u-slider',
		props: {
			// 当前进度百分比值,范围0-100
			value: {
				type: [Number, String],
				default: 0
			},
			// 是否禁用滑块
			disabled: {
				type: Boolean,
				default: false
			},
			// 滑块宽度,高等于宽,单位rpx
			blockWidth: {
				type: [Number, String],
				default: 40
			},
			// 最小值
			min: {
				type: [Number, String],
				default: 0
			},
			// 最大值
			max: {
				type: [Number, String],
				default: 99
			},
			// 步进值
			step: {
				type: [Number, String],
				default: 11
			},
			// 滑块条高度,单位rpx
			height: {
				type: [Number, String],
				default: 6
			},
			// 进度条的激活部分颜色
			activeColor: {
				type: String,
				default: '#445FED'
			},
			// 进度条的背景颜色
			inactiveColor: {
				type: String,
				default: '#DCDCDC'
			},
			// 滑块的背景颜色
			blockColor: {
				type: String,
				default: 'url(https://yiben01.oss-cn-hangzhou.aliyuncs.com/img/c5f080bdcbea8a6147e074099d25d11cd2d150c2_120.png) center/100% 100% no-repeat'
			},
			// 用户对滑块的自定义颜色
			blockStyle: {
				type: Object,
				default () {
					return {};
				}
			},
		},
		data() {
			return {
				startX: 0,
				status: 'end',
				newValue: 0,
				distanceX: 0,
				startValue: 0,
				barStyle: {},
				sliderRect: {
					left: 0,
					width: 0
				}
			};
		},
		watch: {
			value(n) {
				// 只有在非滑动状态时,才可以通过value更新滑块值,这里监听,是为了让用户触发
				if (this.status == 'end') this.updateValue(this.value, false);
			}
		},
		created() {
			this.updateValue(this.value, false);
		},
		mounted() {
			// 获取滑块条的尺寸信息
			this.$uGetRect('.u-slider').then(rect => {
				this.sliderRect = rect;
			});
		},
		methods: {
			onTouchStart(event) {
				if (this.disabled) return;
				this.startX = 0;
				// 触摸点集
				let touches = event.touches[0];
				// 触摸点到屏幕左边的距离
				this.startX = touches.clientX;
				// 此处的this.value虽为props值,但是通过$emit('input')进行了修改
				this.startValue = this.format(this.value);
				// 标示当前的状态为开始触摸滑动
				this.status = 'start';
			},
			onTouchMove(event) {
				if (this.disabled) return;
				// 连续触摸的过程会一直触发本方法,但只有手指触发且移动了才被认为是拖动了,才发出事件
				// 触摸后第一次移动已经将status设置为moving状态,故触摸第二次移动不会触发本事件
				if (this.status == 'start') this.$emit('start');
				let touches = event.touches[0];
				// 滑块的左边不一定跟屏幕左边接壤,所以需要减去最外层父元素的左边值
				this.distanceX = touches.clientX - this.sliderRect.left;
				// 获得移动距离对整个滑块的百分比值,此为带有多位小数的值,不能用此更新视图
				// 否则造成通信阻塞,需要每改变一个step值时修改一次视图
				this.newValue = (this.distanceX / this.sliderRect.width) * 100;
				this.status = 'moving';
				// 发出moving事件
				this.$emit('moving');
				this.updateValue(this.newValue, true);
			},
			onTouchEnd() {
				if (this.disabled) return;
				if (this.status === 'moving') {
					this.updateValue(this.newValue, false);
					this.$emit('end');
				}
				this.status = 'end';
			},
			updateValue(value, drag) {
				// 去掉小数部分,同时也是对step步进的处理
				const width = this.format(value);
				// 不允许滑动的值超过max最大值,百分比也不能超过100
				if (width > this.max || width > 100) return;
				// 设置移动的百分比值
				let barStyle = {
					width: width + '%'
				};
				// 移动期间无需过渡动画
				if (drag == true) {
					barStyle.transition = 'none';
				} else {
					// 非移动期间,删掉对过渡为空的声明,让css中的声明起效
					delete barStyle.transition;
				}
				// 修改value值
				this.$emit('input', width);
				this.barStyle = barStyle;
			},
			format(value) {
				// 将小数变成整数,为了减少对视图的更新,造成视图层与逻辑层的阻塞
				return Math.round(Math.max(this.min, Math.min(value, this.max)) / this.step) * this.step;
			},
			onClick(event) {
				if (this.disabled) return;
				// 直接点击滑块的情况,计算方式与onTouchMove方法相同
				const value = ((event.detail.x - this.sliderRect.left) / this.sliderRect.width) * 100;
				this.updateValue(value, false);
			}
		}
	};
</script>

<style lang="scss" scoped>
	// @import "../../libs/css/style.components.scss";
	.u-slider {
		width: 90%;
		margin: auto;
		position: relative;
		border-radius: 999px;
		border-radius: 999px;
		background-color: #ebedf0;
	}

	.u-slider:before {
		position: absolute;
		right: 0;
		left: 0;
		content: '';
		top: -8px;
		bottom: -8px;
		z-index: -1;
	}

	.u-slider__gap {
		position: relative;
		border-radius: inherit;
		transition: width 0.2s;
		transition: width 0.2s;
		background-color: #1989fa;
	}

	.u-slider__button {
		width: 24px;
		height: 24px;
		border-radius: 50%;
		box-shadow: 0 1px 2px rgba(0, 0, 0, 0.5);
		background-color: #fff;
		cursor: pointer;
	}

	.u-slider__button-wrap {
		position: absolute;
		top: 50%;
		right: 0;
		transform: translate3d(50%, -50%, 0);
	}

	.u-slider--disabled {
		opacity: 0.5;
	}
</style>
如果显示 echarts.min.js 超过500k,解决办法:https://blog.csdn.net/HXH_csdn/article/details/106265308
我就是这个解决的,(可以把这些安装在别的测试项目,最后只要把那个压缩后的文件复制就可以了)
最后的最后,讲一下点击事件里具体的值
myChart.getZr().on('click', params => {
    const actionObj = params.target
    console.log('actionObj', actionObj)
    const myKey = Object.keys(actionObj).sort().filter(_ => _.indexOf('ec_inner') !== -1)[0]
    console.log('myKey', myKey)
    const res = actionObj[myKey]
    console.log(`当前点击了第${res.dataIndex}组数据中的第${res.seriesIndex}个柱子`)
    var pointInPixel = [params.offsetX, params.offsetY];
    // 这个判断是  判断是否出界
    if (myChart.containPixel('grid', pointInPixel)) {
        /*此处添加具体执行代码*/
        var pointInGrid = myChart.convertFromPixel({ seriesIndex: 0 }, pointInPixel);
        //X轴序号
        var xIndex = pointInGrid[0];
        console.log('点击了横纵坐标', pointInPixel)
        console.log('【点击了第几组数据,纵坐标】', pointInGrid)
        //获取当前图表的option
        var op = myChart.getOption();
        console.log('数据信息', op)
        //获得图表中我们想要的数据---下面就不简写了,默认说我们的折现有2条吧
        var xValue = op.xAxis[0].data[xIndex];
        console.log('x轴所对应的名字', xValue)

    }
});


 2780
2780


 被折叠的 条评论
为什么被折叠?
被折叠的 条评论
为什么被折叠?
 到【灌水乐园】发言


