


在做项目的时候,遇到了需要添加一个环形图,这就需要用到echarts了,亲测有效
项目需求:
第一步:在项目中使用npm进行下载
npm install echarts mpvue-echarts,
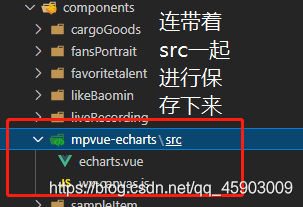
然后在package-lock.json文件中找到 mpvue-echarts,并点进去链接将 mpvue-echarts进行本地下载
第二步:将下载以后的src文件存放到项目的compont文件下
第三步:在项目需要的地方进行引入
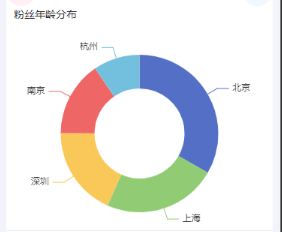
<view class="age Portrait">
<text>粉丝年龄分布</text>
<view class="echarts-wrap">
<mpvue-echarts class="ec-canvas" @onInit="onInit" canvasId="demo-canvas" ref="chart1" />
</view>
</view>
import mpvueEcharts from '../../components/mpvue-echarts/src/echarts';
import * as echarts from "echarts/dist/echarts.min";
let chart1 = null;
export default {
data(){
return{
echarts,
}
},
components: {
mpvueEcharts
},
methods:{
changeChart() {
chart1.setOption(this.getOptions(10, 30));
},
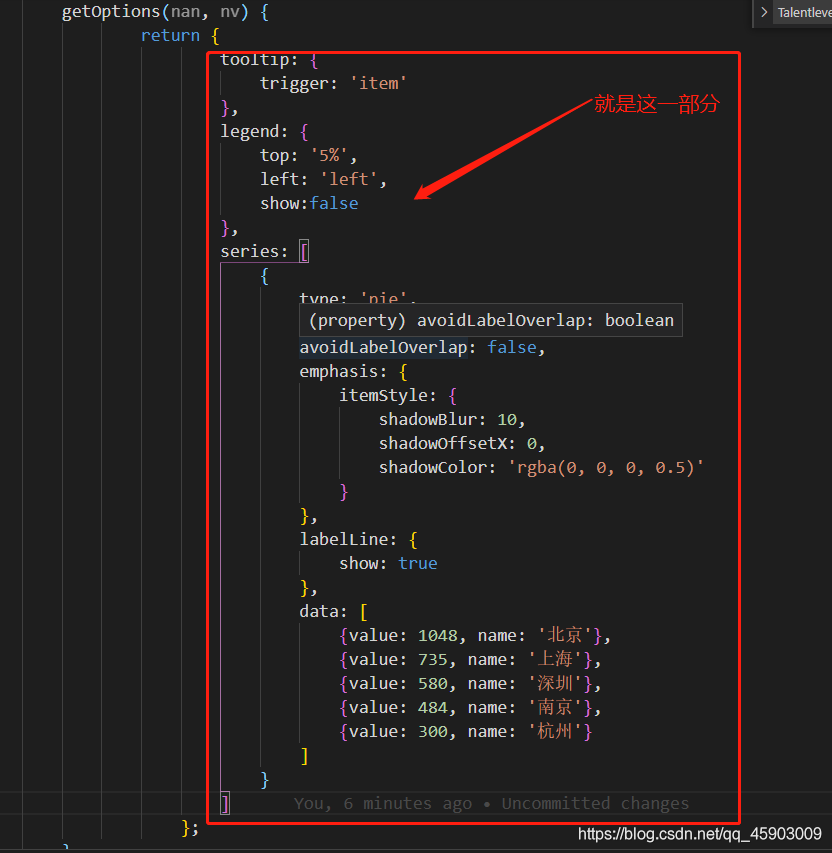
getOptions(nan, nv) {
return {
tooltip: {
trigger: 'item'
},
legend: {
top: '5%',
left: 'left',
show:false
},
series: [
{
type: 'pie',
radius: ['40%', '70%'],
avoidLabelOverlap: false,
emphasis: {
itemStyle: {
shadowBlur: 10,
shadowOffsetX: 0,
shadowColor: 'rgba(0, 0, 0, 0.5)'
}
},
labelLine: {
show: true
},
data: [
{value: 1048, name: '北京'},
{value: 735, name: '上海'},
{value: 580, name: '深圳'},
{value: 484, name: '南京'},
{value: 300, name: '杭州'}
]
}
]
};
},
onInit(e) {
let { width, height } = e;
let canvas = this.$refs.chart1.canvas;
echarts.setCanvasCreator(() => canvas);
chart1 = echarts.init(canvas, null, {
width: width,
height: height
});
canvas.setChart(chart1);
chart1.setOption(this.getOptions(50, 10));
this.$refs.chart1.setChart(chart1);
}
}
}
第四步:要是报this.echarts.setCanvasCreator is not a function错的话,就将下载下来的
echarts文件使用下来的代码进行替换掉即可
<template>
  <canvas
    v-if="canvasId"
    class="ec-canvas"
    :id="canvasId"
    :canvasId="canvasId"
    @touchstart="touchStart"
    @touchmove="touchMove"
    @touchend="touchEnd"
    @error="error"
  ></canvas>
</template>
<script>
import WxCanvas from "./wx-canvas";
export default {
  props: {
    canvasId: {
      type: String,
      default: "ec-canvas",
    },
    lazyLoad: {
      type: Boolean,
      default: false,
    },
    disableTouch: {
      type: Boolean,
      default: false,
    },
    throttleTouch: {
      type: Boolean,
      default: false,
    },
  },
  // #ifdef H5
  mounted() {
    if (!this.lazyLoad) this.init();
  },
  // #endif
  // #ifndef H5
  onReady() {
    if (!this.lazyLoad) this.init();
  },
  // #endif
  methods: {
    setChart(chart) {
      this.chart = chart;
    },
    init() {
      const { canvasId } = this;
      this.ctx = wx.createCanvasContext(canvasId, this);
      this.canvas = new WxCanvas(this.ctx, canvasId);
      const query = wx.createSelectorQuery().in(this);
      query
        .select(`#${canvasId}`)
        .boundingClientRect((res) => {
          if (!res) {
            setTimeout(() => this.init(), 50);
            return;
          }
          this.$emit("onInit", {
            width: res.width,
            height: res.height,
          });
        })
        .exec();
    },
    canvasToTempFilePath(opt) {
      const { canvasId } = this;
      this.ctx.draw(true, () => {
        wx.canvasToTempFilePath({
          canvasId,
          ...opt,
        });
      });
    },
    touchStart(e) {
      const { disableTouch, chart } = this;
      if (disableTouch || !chart || !e.mp.touches.length) return;
      const touch = e.mp.touches[0];
      chart._zr.handler.dispatch("mousedown", {
        zrX: touch.x,
        zrY: touch.y,
      });
      chart._zr.handler.dispatch("mousemove", {
        zrX: touch.x,
        zrY: touch.y,
      });
    },
    touchMove(e) {
      const { disableTouch, throttleTouch, chart, lastMoveTime } = this;
      if (disableTouch || !chart || !e.mp.touches.length) return;
      if (throttleTouch) {
        const currMoveTime = Date.now();
        if (currMoveTime - lastMoveTime < 240) return;
        this.lastMoveTime = currMoveTime;
      }
      const touch = e.mp.touches[0];
      chart._zr.handler.dispatch("mousemove", {
        zrX: touch.x,
        zrY: touch.y,
      });
    },
    touchEnd(e) {
      const { disableTouch, chart } = this;
      if (disableTouch || !chart) return;
      const touch = e.mp.changedTouches ? e.mp.changedTouches[0] : {};
      chart._zr.handler.dispatch("mouseup", {
        zrX: touch.x,
        zrY: touch.y,
      });
      chart._zr.handler.dispatch("click", {
        zrX: touch.x,
        zrY: touch.y,
      });
    },
  },
};
</script>
<style scoped>
.ec-canvas {
  width: 100%;
  height: 100%;
  flex: 1;
}
</style>
第五步:插入自己想要的任何图例
注意的是:使用echarts,找到自己想要插入的文件的实例
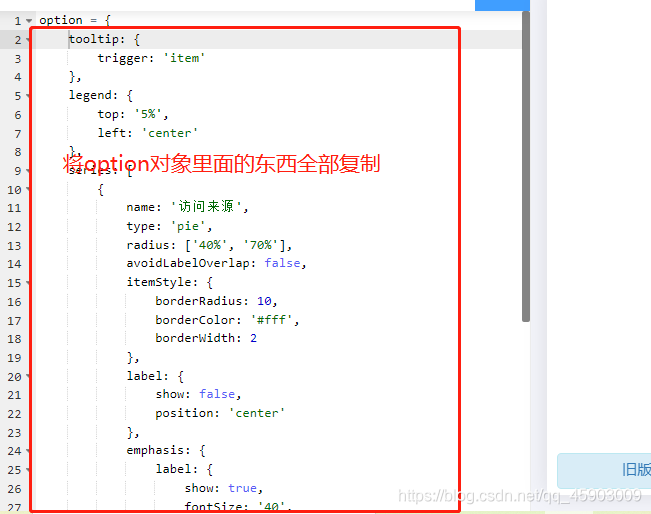
第六步:找到引入mp-echarts文件的地方,将其中return对象里的值全部替换成在echarts中复制过来的即可


 2万+
2万+


 被折叠的 条评论
为什么被折叠?
被折叠的 条评论
为什么被折叠?
 到【灌水乐园】发言


