import matplotlib.pyplot as plt
import numpy as np
# 这两行代码解决 plt 中文显示的问题
plt.rcParams['font.sans-serif'] = ['SimHei']
plt.rcParams['axes.unicode_minus'] = False
# 输入统计数据
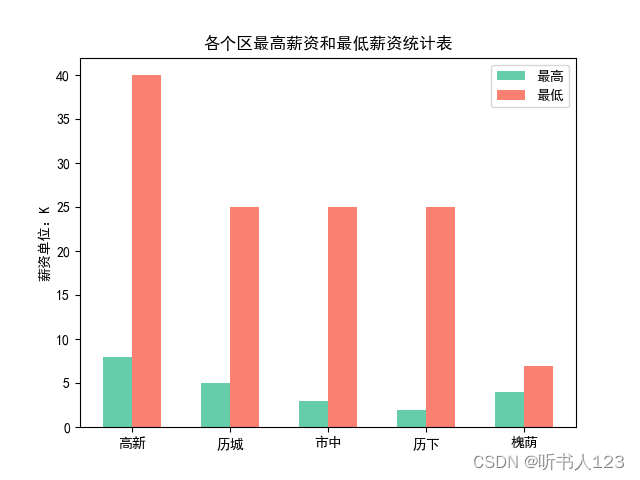
waters = ('高新', '历城', '市中', '历下', '槐荫')
high = [8, 5, 3, 2, 4]
low = [40, 25, 25, 25, 7]
bar_width = 0.3 # 条形宽度
index_male = np.arange(len(waters))
index_female = index_male + bar_width
# 使用两次 bar 函数画出两组条形图
plt.bar(index_male, height=high, width=bar_width, color='mediumaquamarine', label='最高')
plt.bar(index_female, height=low, width=bar_width, color='salmon', label='最低')
plt.legend() # 显示图例
plt.xticks(index_male + bar_width/2, waters) # 让横坐标轴刻度显示 waters 里的饮用水, index_male + bar_width/2 为横坐标轴刻度的位置
plt.ylabel('薪资单位:K') # 纵坐标轴标题
plt.title('各个区最高薪资和最低薪资统计表') # 图形标题
plt.show()


 14万+
14万+


 被折叠的 条评论
为什么被折叠?
被折叠的 条评论
为什么被折叠?
 到【灌水乐园】发言


