


Nacos 0.8.0版本完善了监控系统,支持通过暴露metrics数据接入第三方监控系统监控Nacos运行状态,目前支持prometheus、elastic search和influxdb,下面结合prometheus和grafana如何监控Nacos,官网grafana监控页面。
搭建Nacos集群暴露metrics数据
按照部署文档搭建好Nacos集群(具体可参考之前的博客)
配置application.properties文件,暴露metrics数据
management.endpoints.web.exposure.include=*
访问{ip}:8848/nacos/actuator/prometheus,看是否能访问到metrics数据
搭建prometheus采集Nacos metrics数据
下载你想安装的prometheus版本,地址为download prometheus
linux & mac
解压prometheus压缩包
tar xvfz prometheus-*.tar.gz
cd prometheus-*
修改配置文件prometheus.yml采集Nacos metrics数据
    metrics_path: '/nacos/actuator/prometheus'
    static_configs:
      - targets: ['{ip1}:8848','{ip2}:8848','{ip3}:8848']
启动prometheus服务
./prometheus --config.file="prometheus.yml"
windows
下载对应的windows版本并解压
修改配置文件prometheus.yml采集Nacos metrics数据
    metrics_path: '/nacos/actuator/prometheus'
    static_configs:
      - targets: ['{ip1}:8848','{ip2}:8848','{ip3}:8848']
启动prometheus服务
prometheus.exe --config.file=prometheus.yml
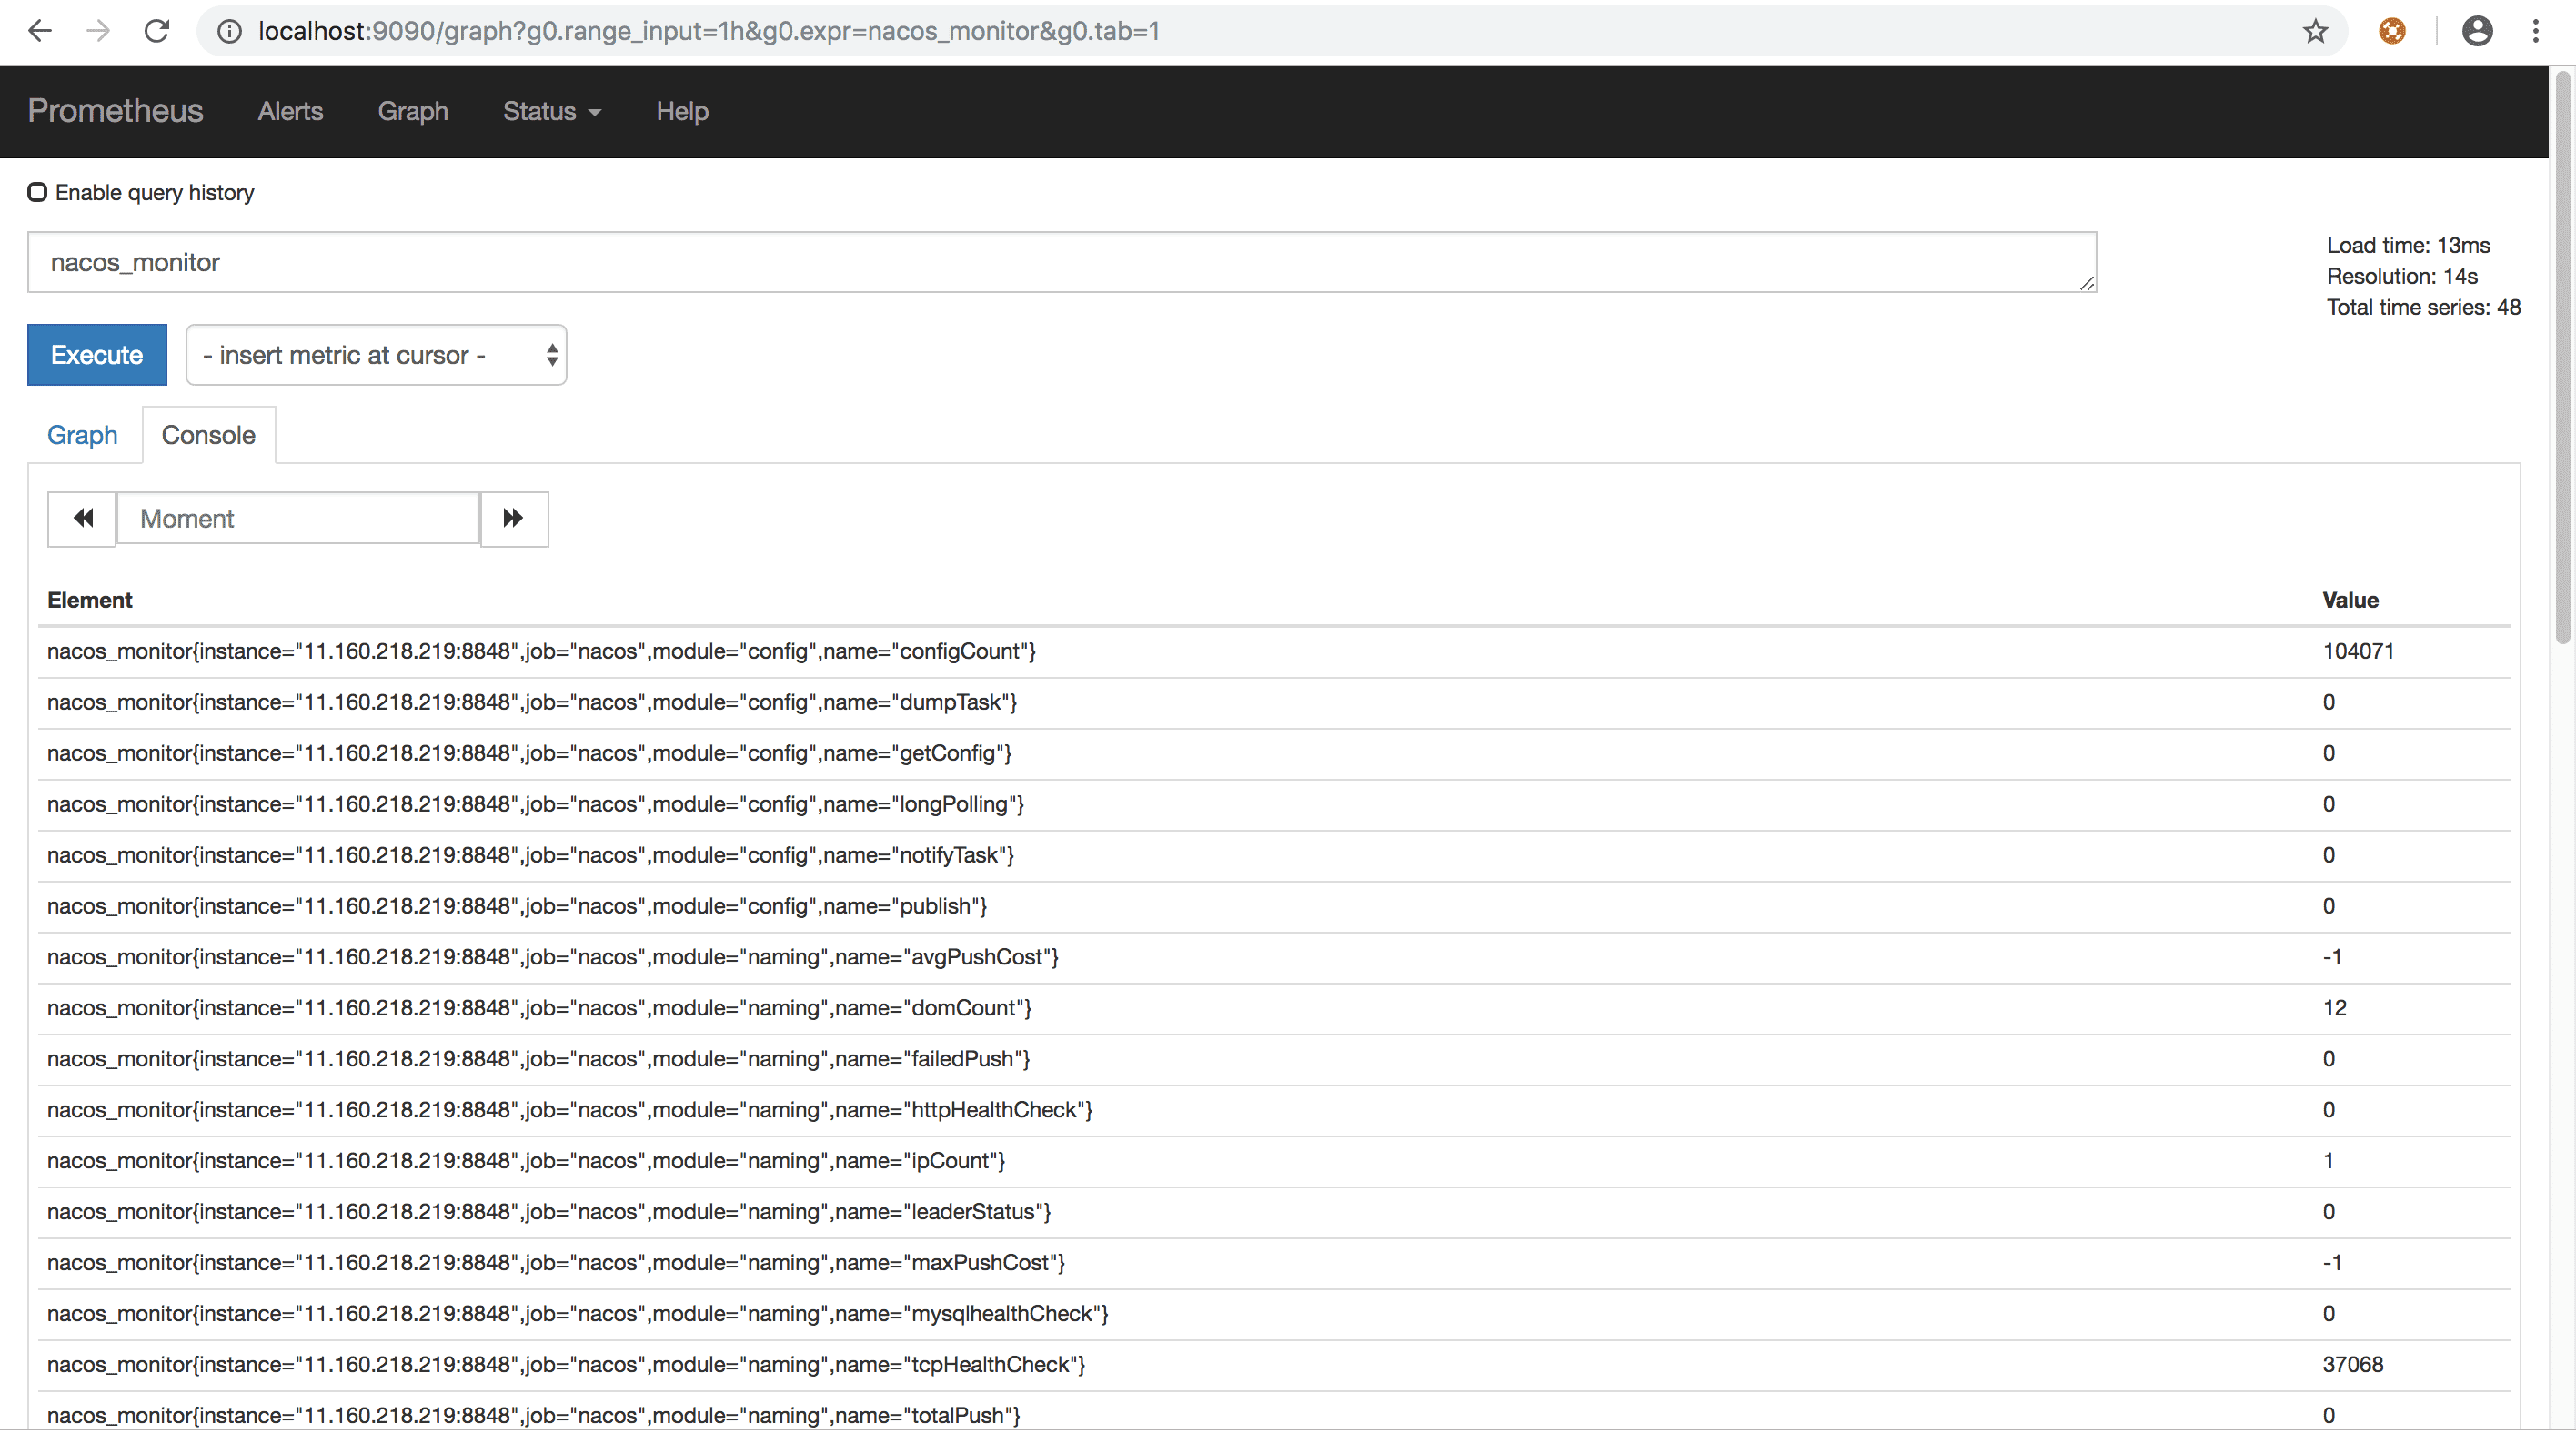
通过访问http://{ip}:9090/graph可以看到prometheus的采集数据,在搜索栏搜索nacos_monitor可以搜索到Nacos数据说明采集数据成功
搭建grafana图形化展示metrics数据
和prometheus在同一台机器上安装grafana,使用 yum 安装grafana
mac
brew install grafana
brew services start grafana
linux
sudo yum install https://s3-us-west-2.amazonaws.com/grafana-releases/release/grafana-5.2.4-1.x86_64.rpm
sudo service grafana-server start
windows
参考文档:Install on Windows | Grafana documentation
访问grafana: http://{ip}:3000
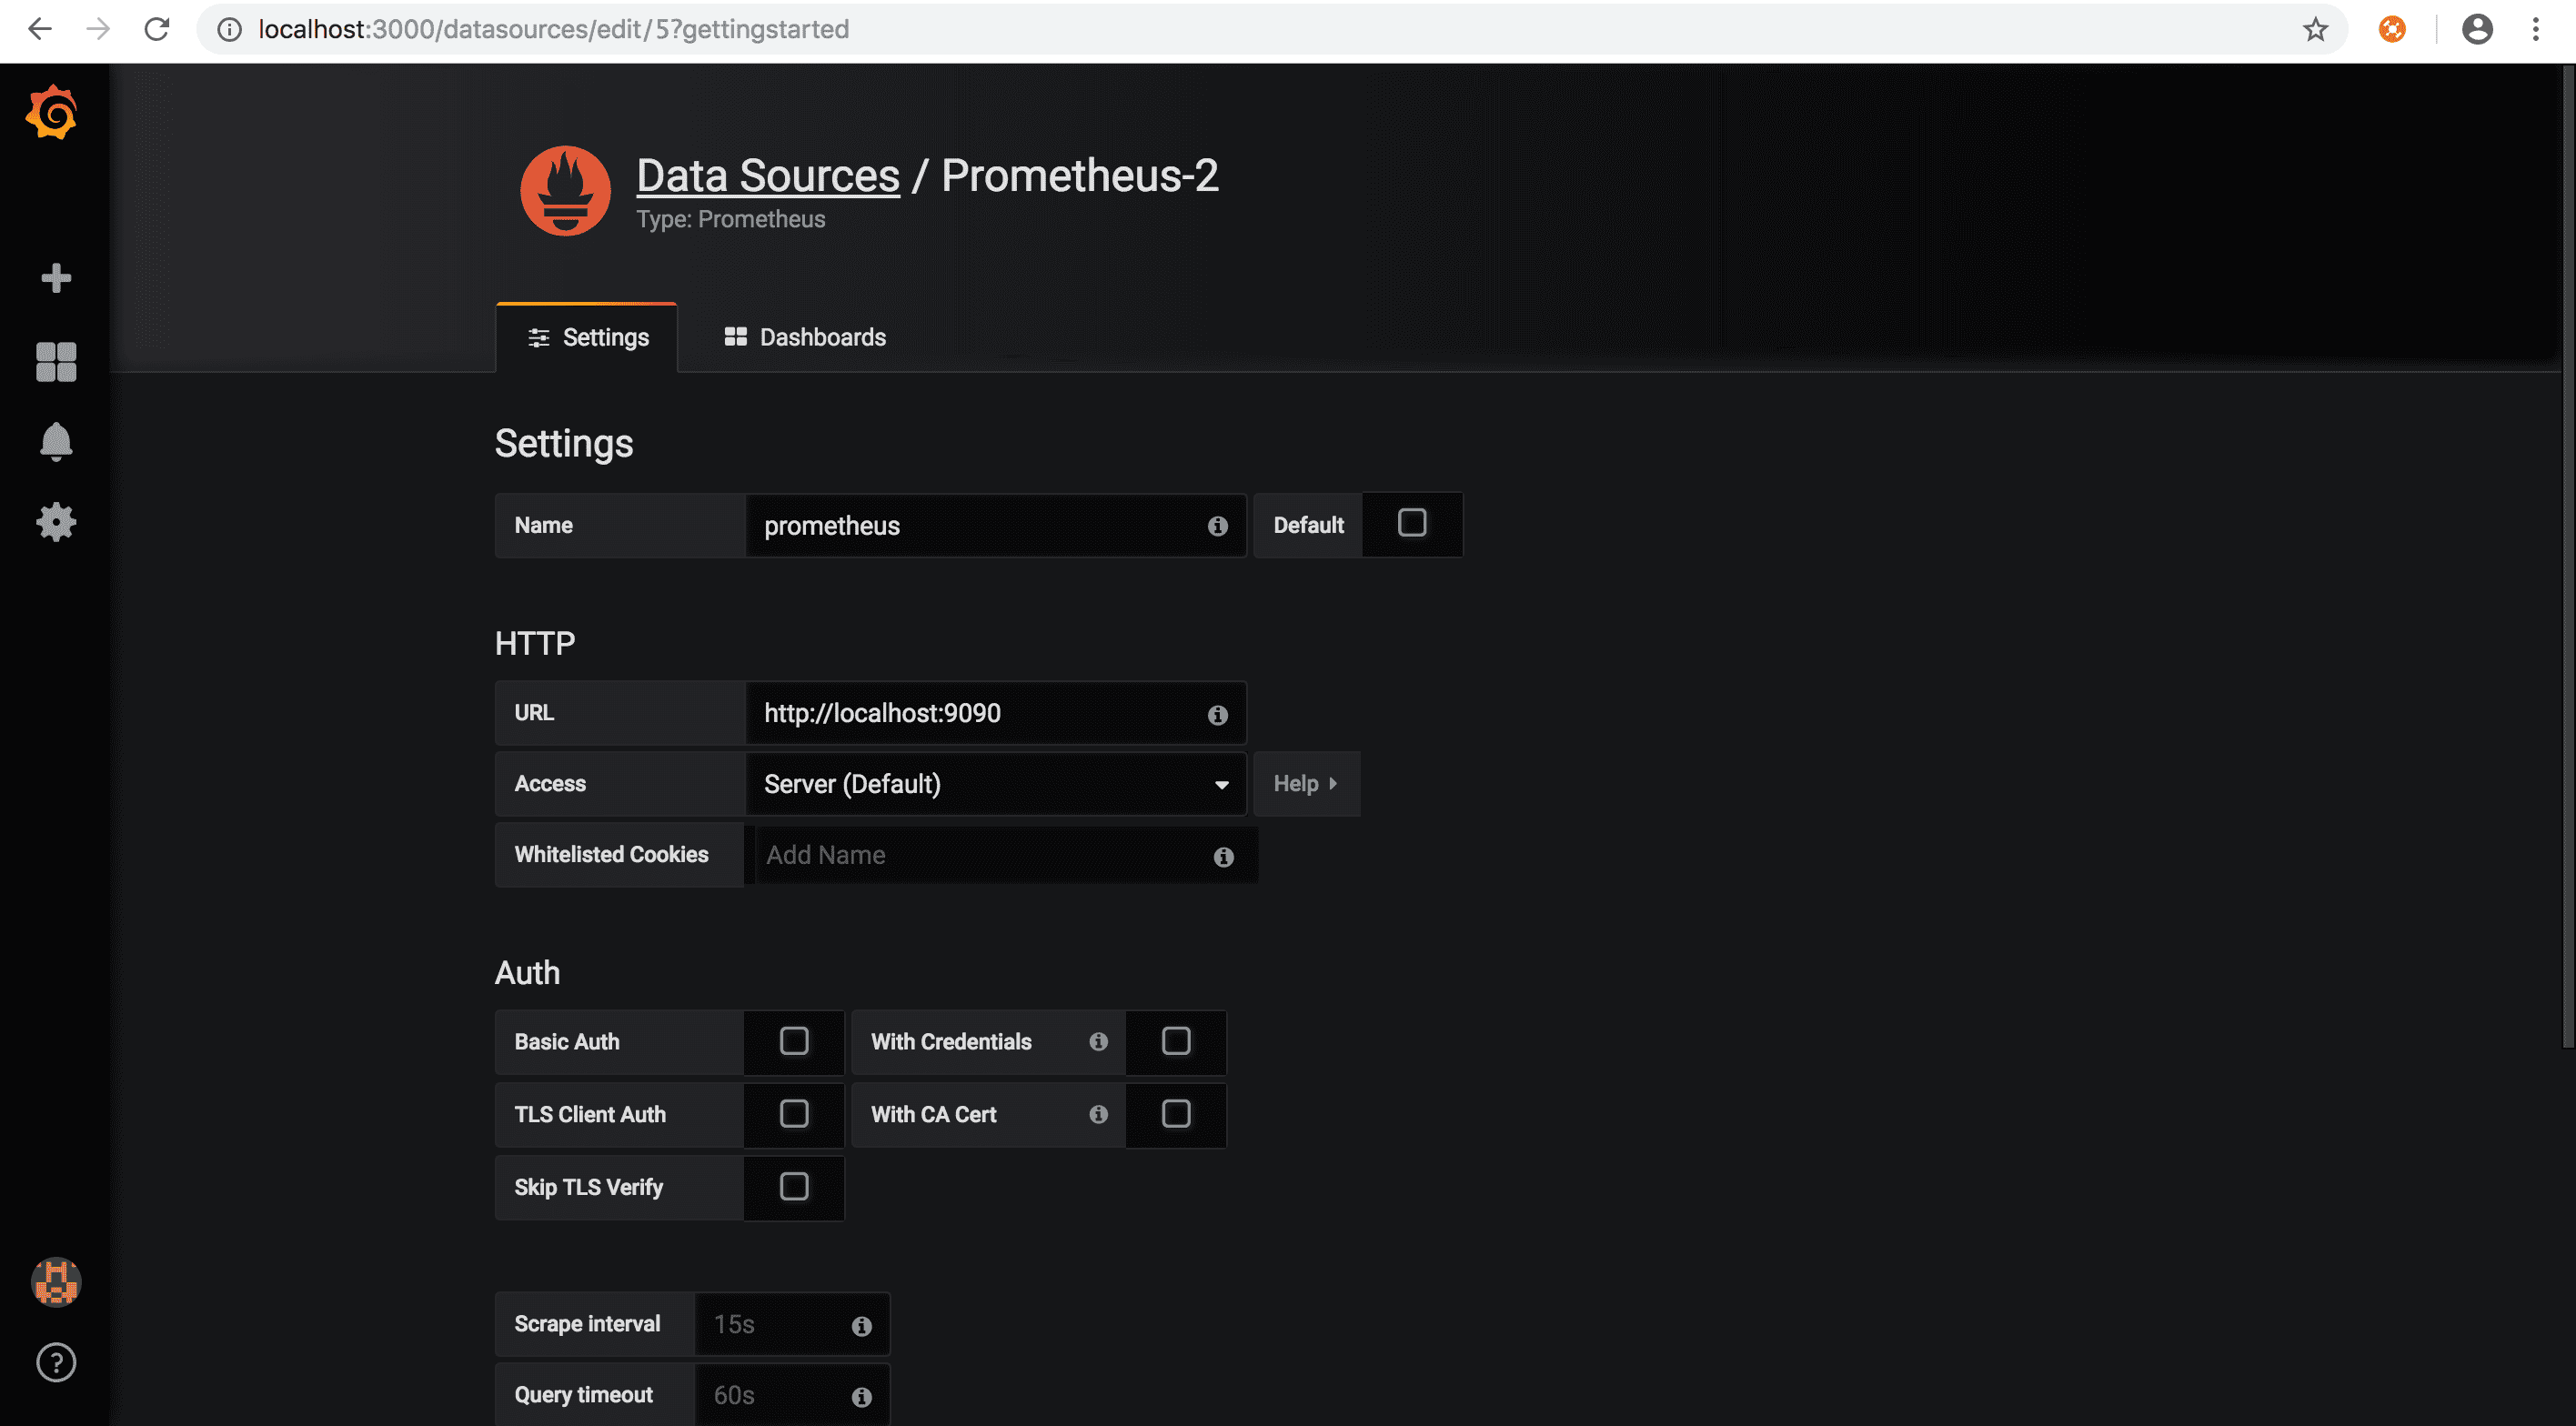
配置prometheus数据源
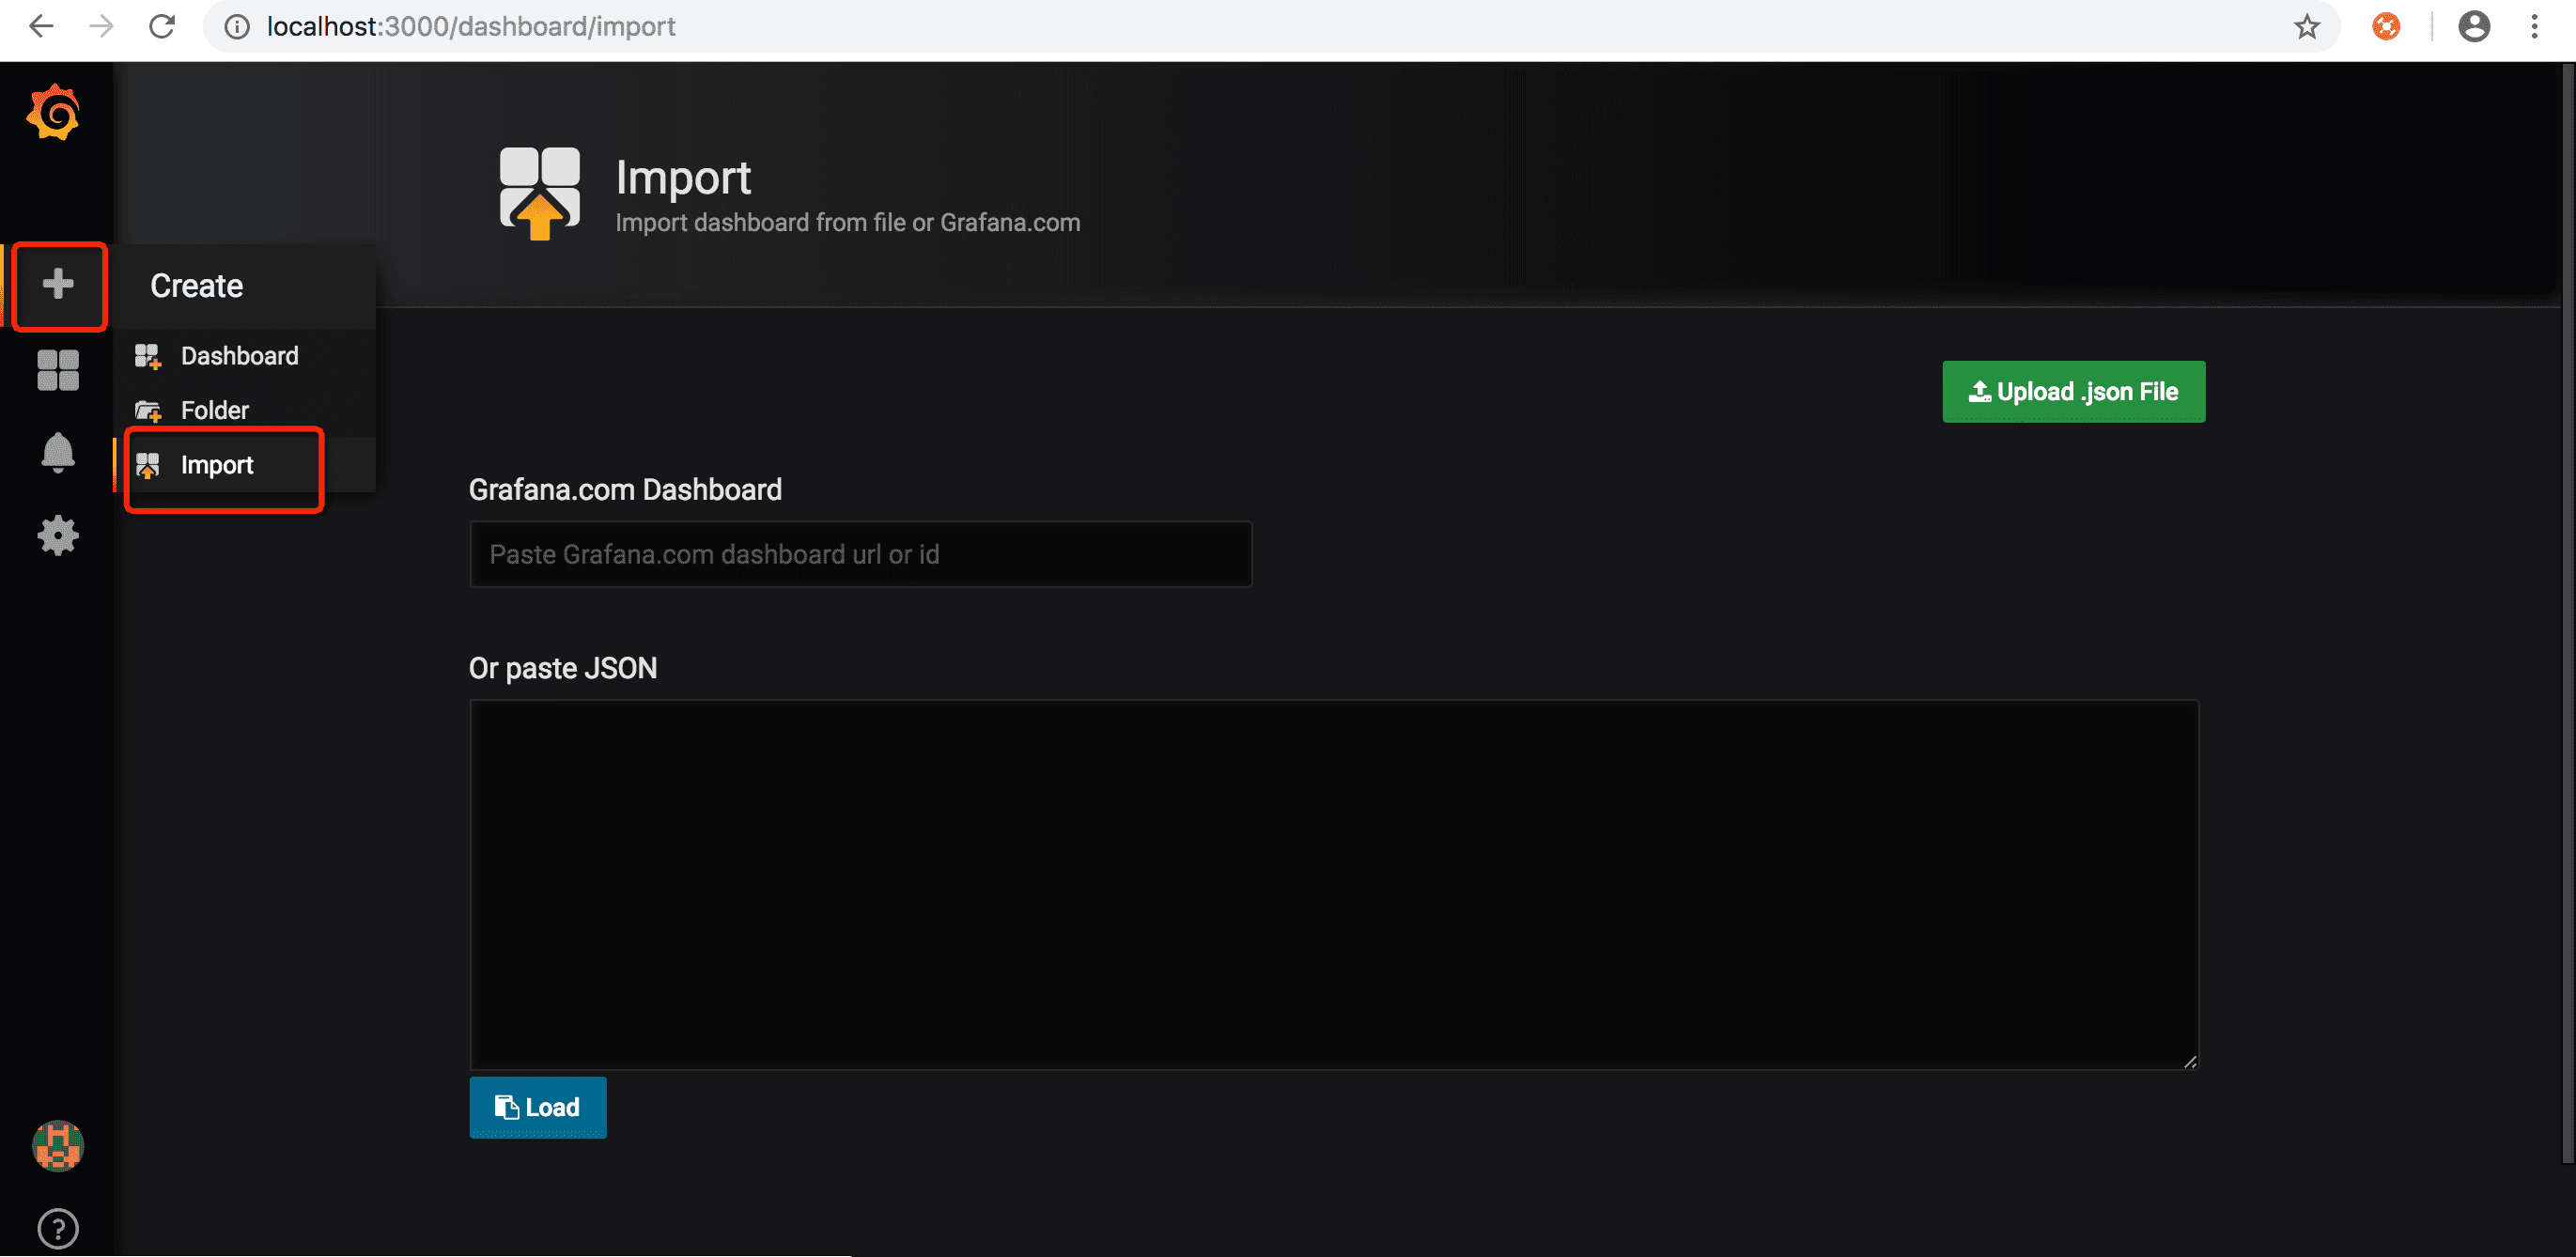
导入Nacos grafana监控模版
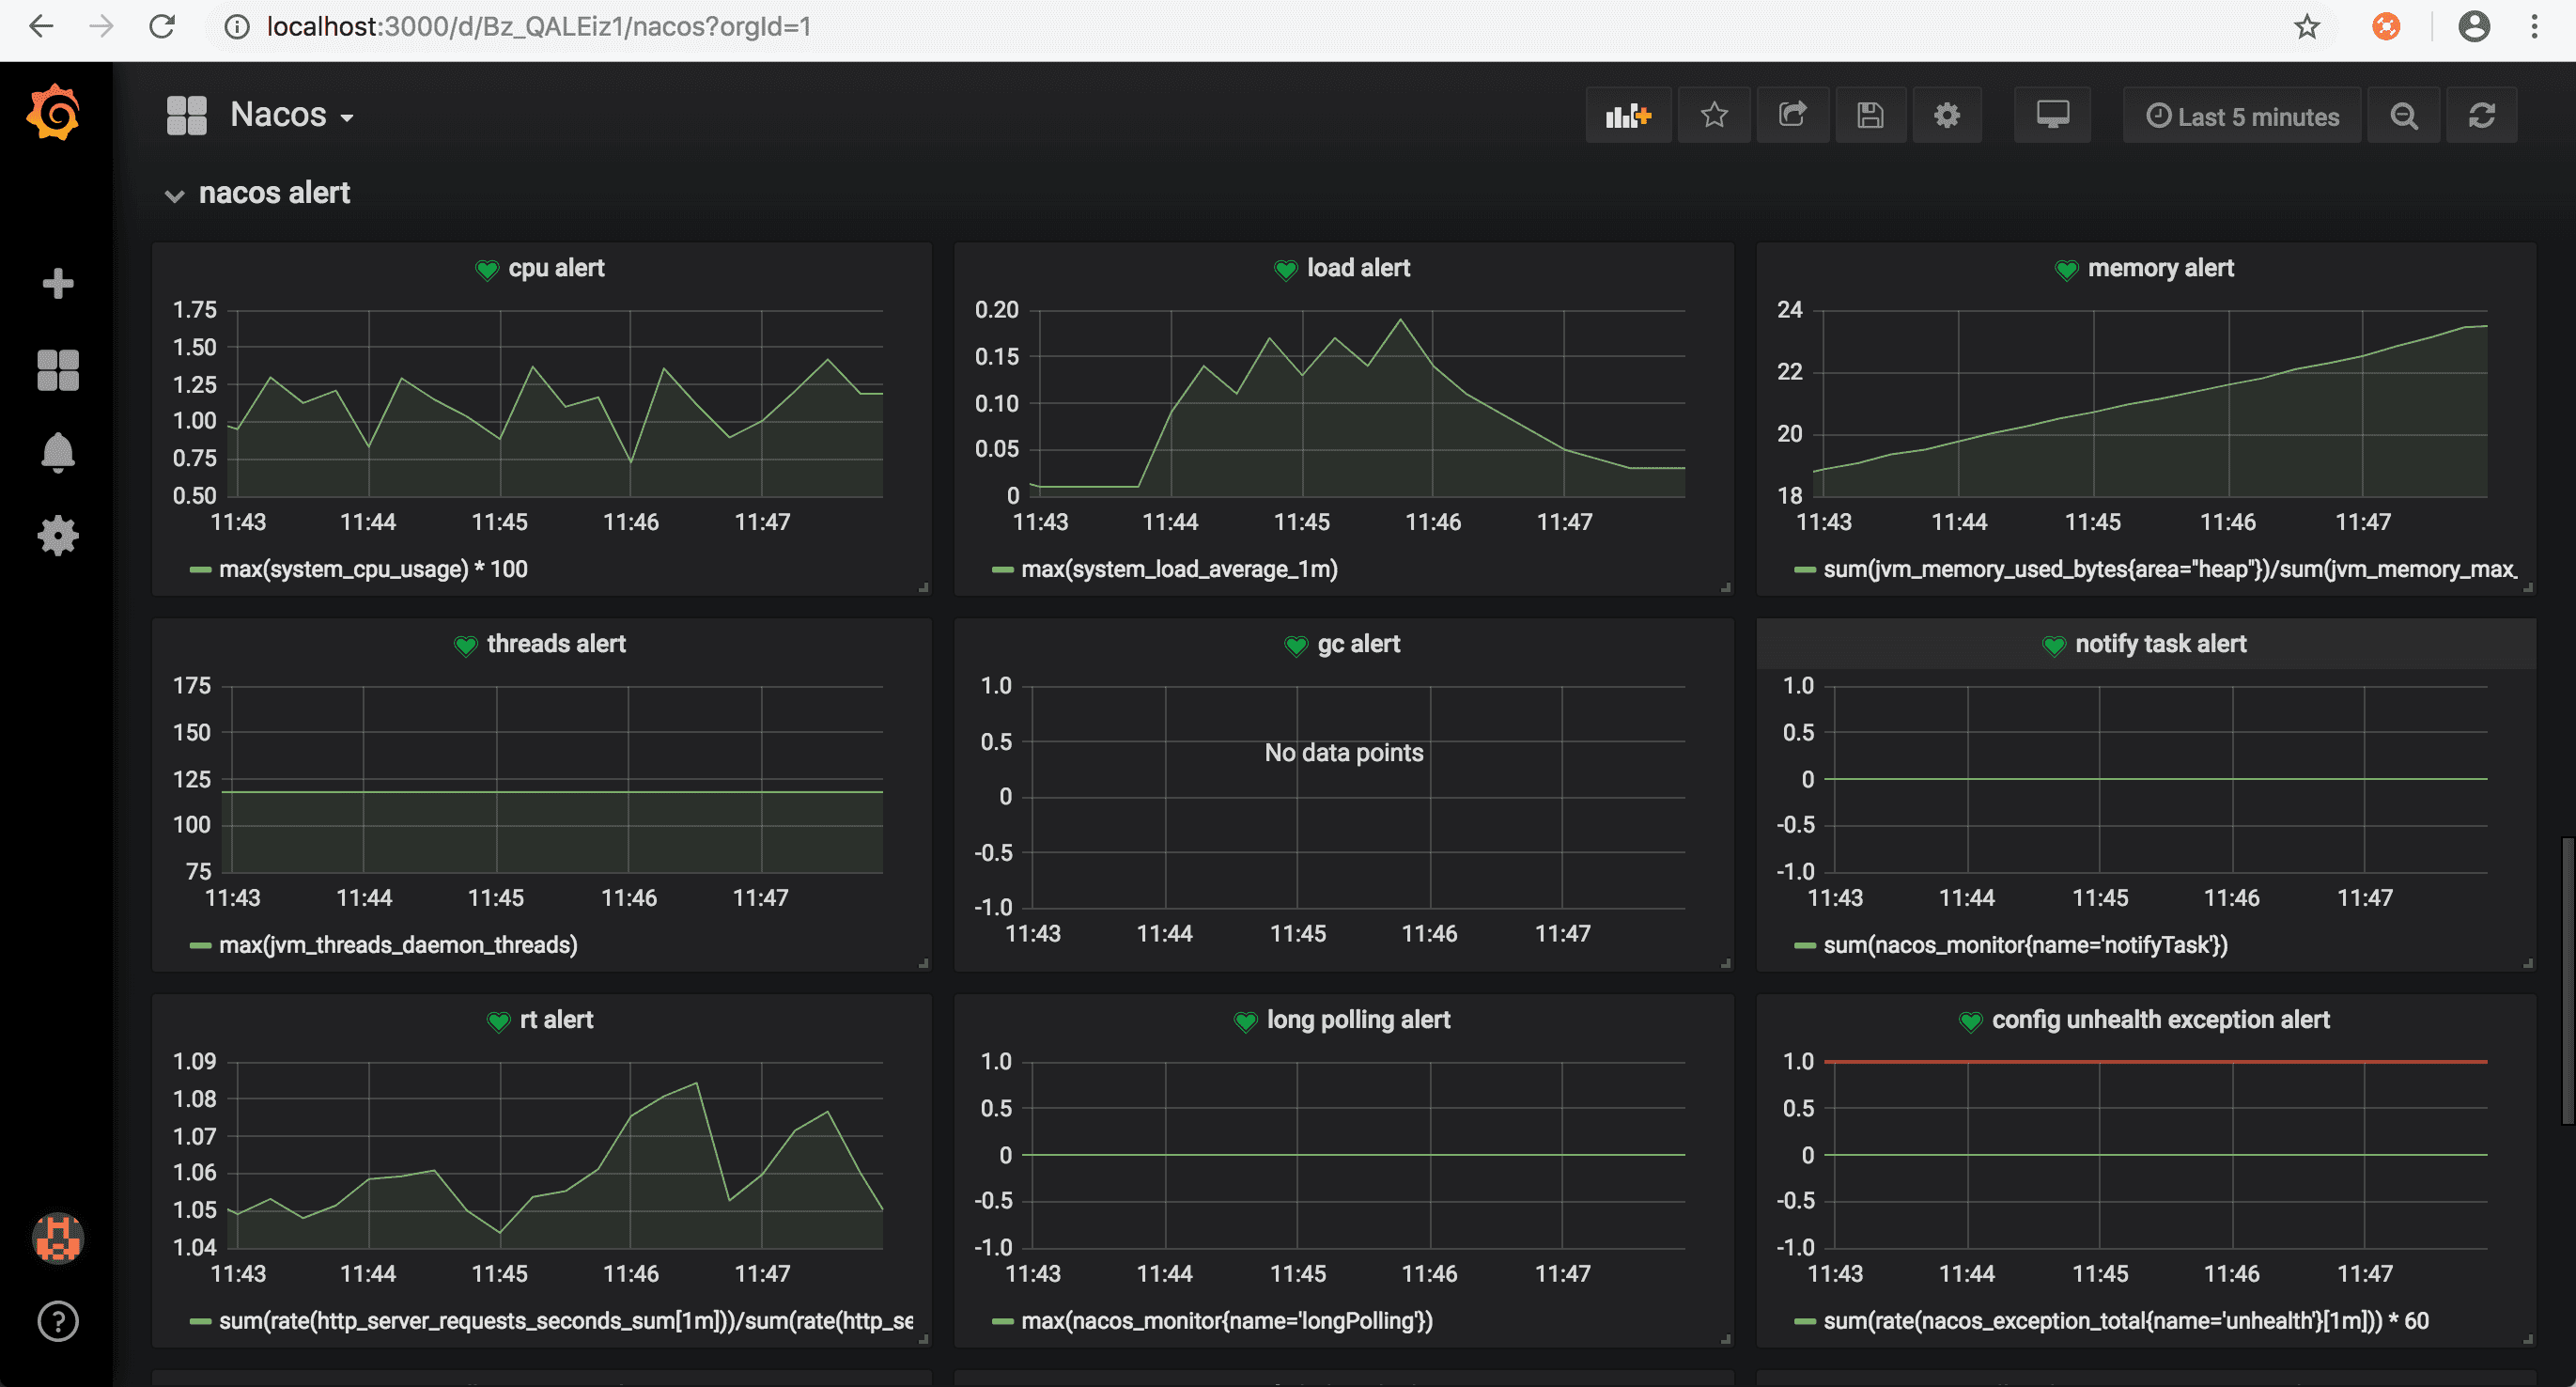
Nacos监控分为三个模块:
- nacos monitor展示核心监控项
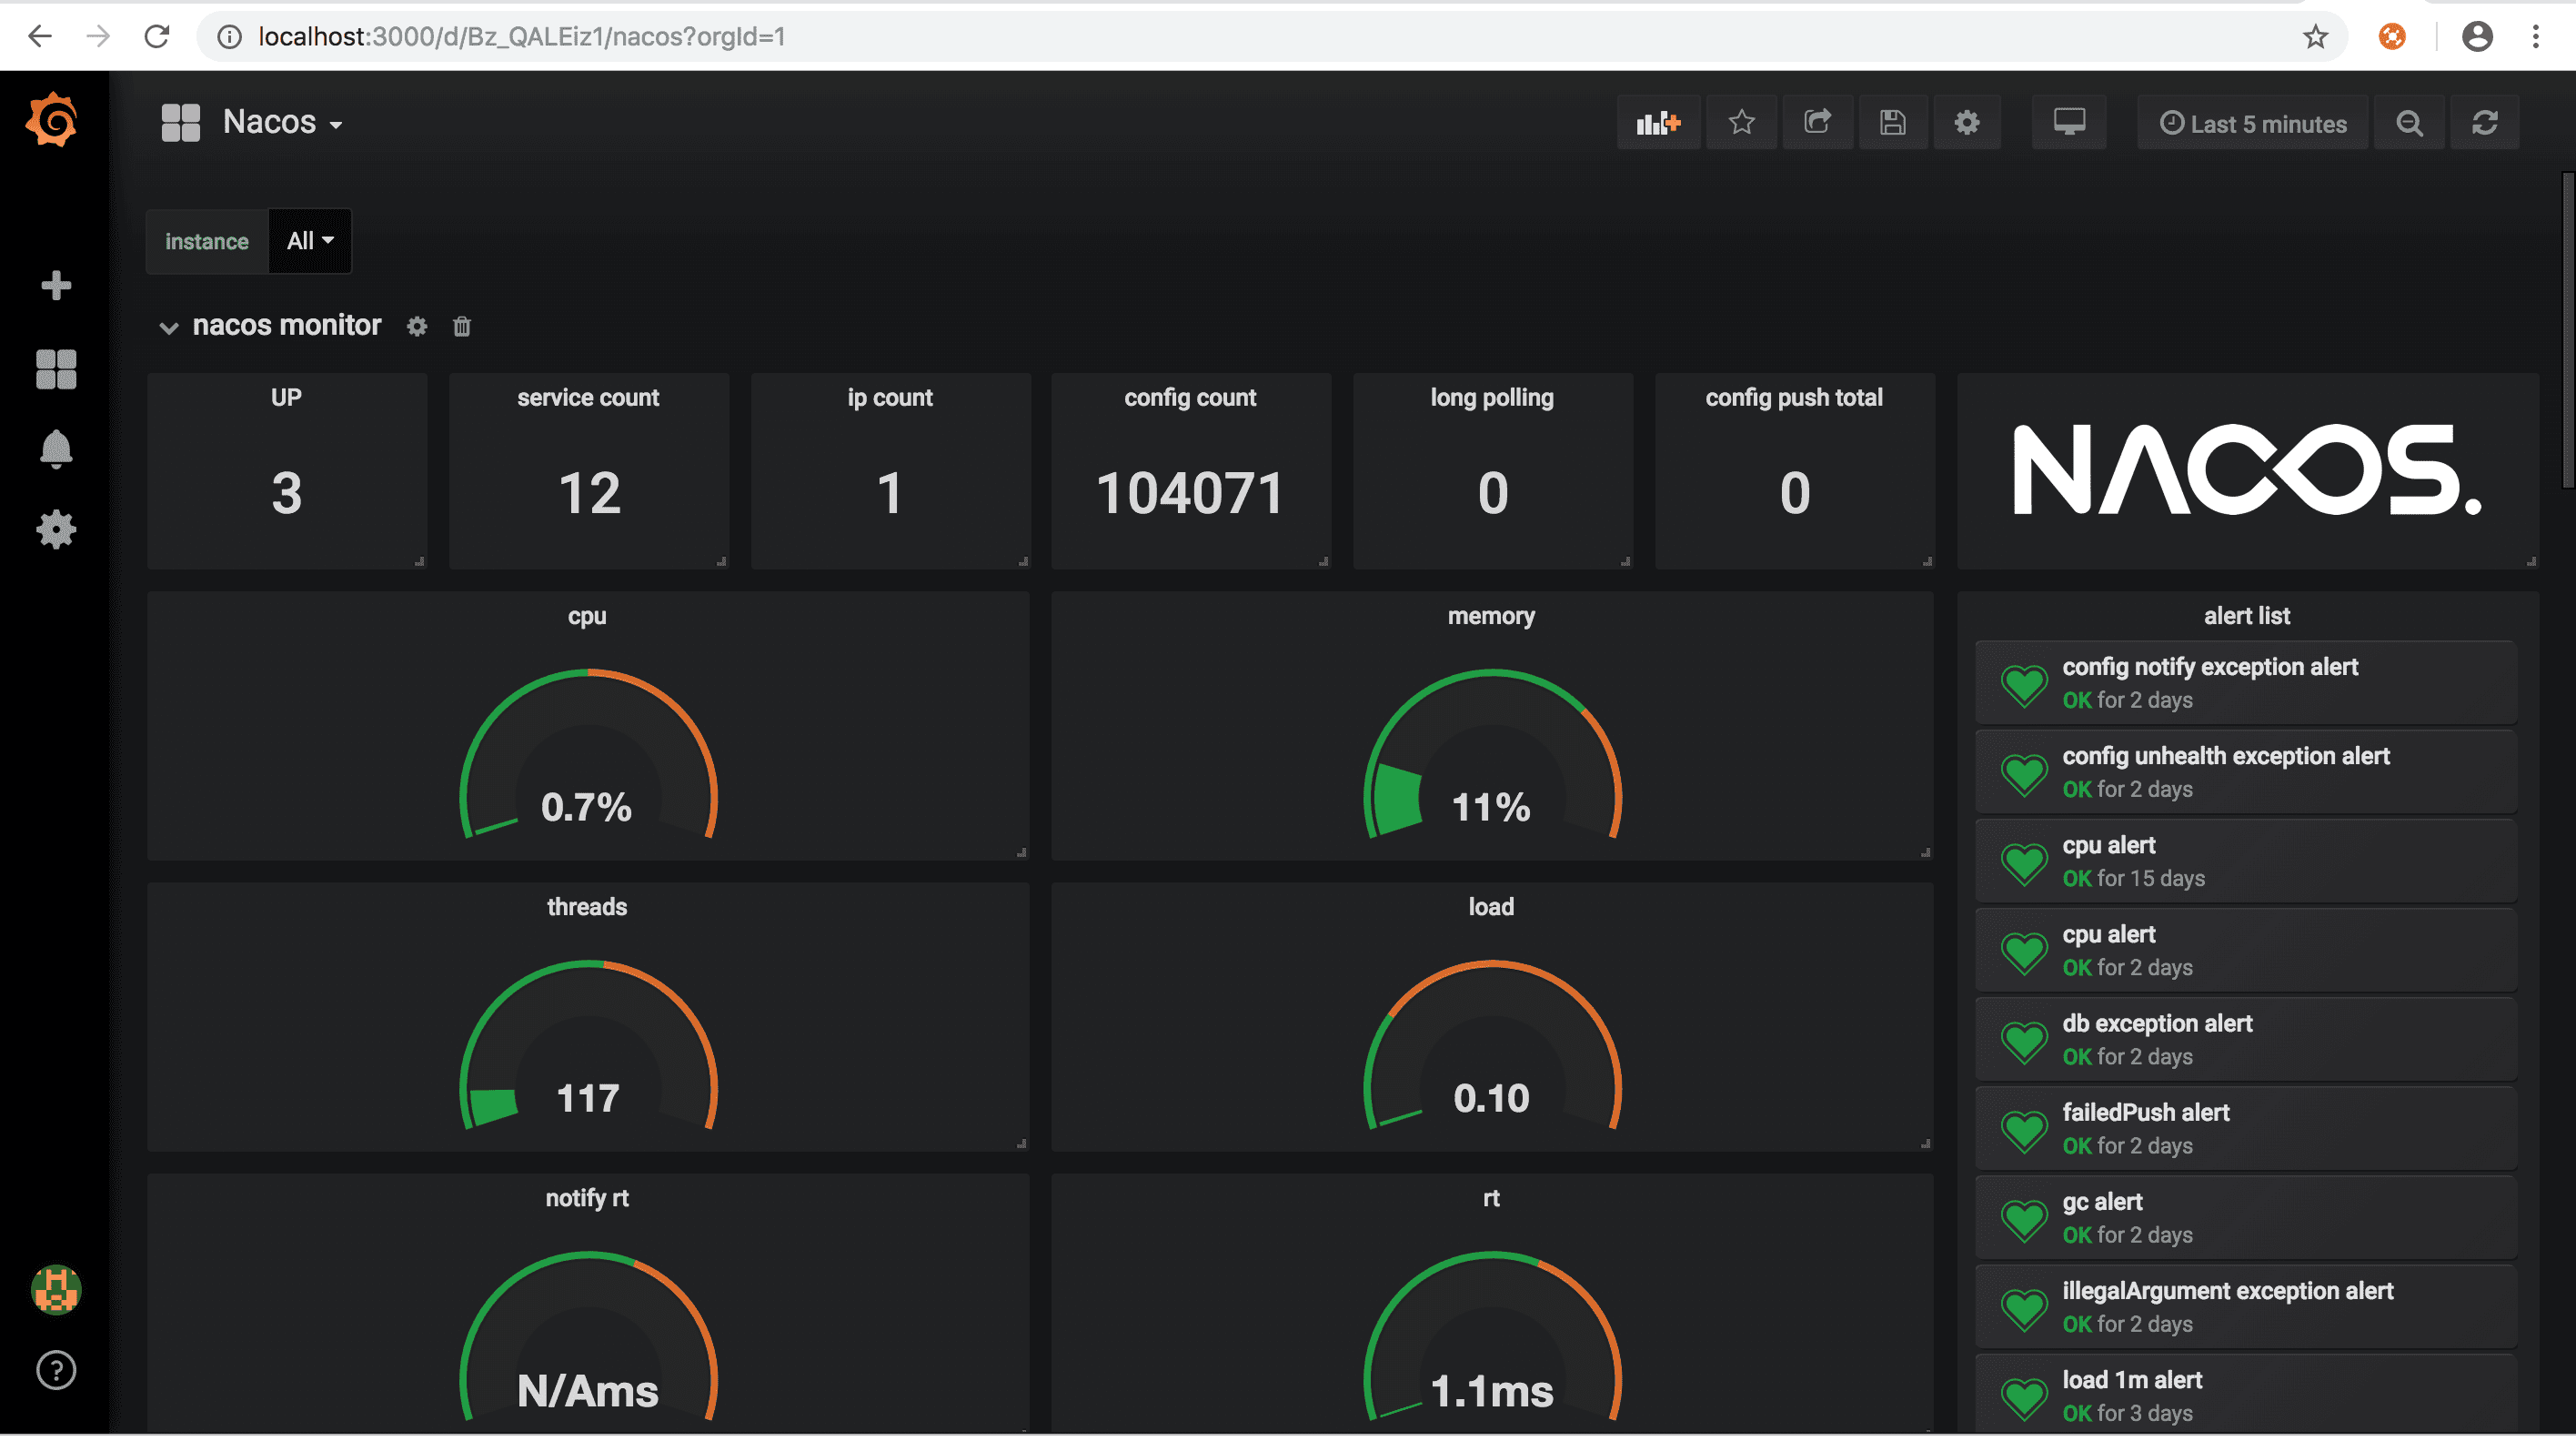
- nacos detail展示指标的变化曲线
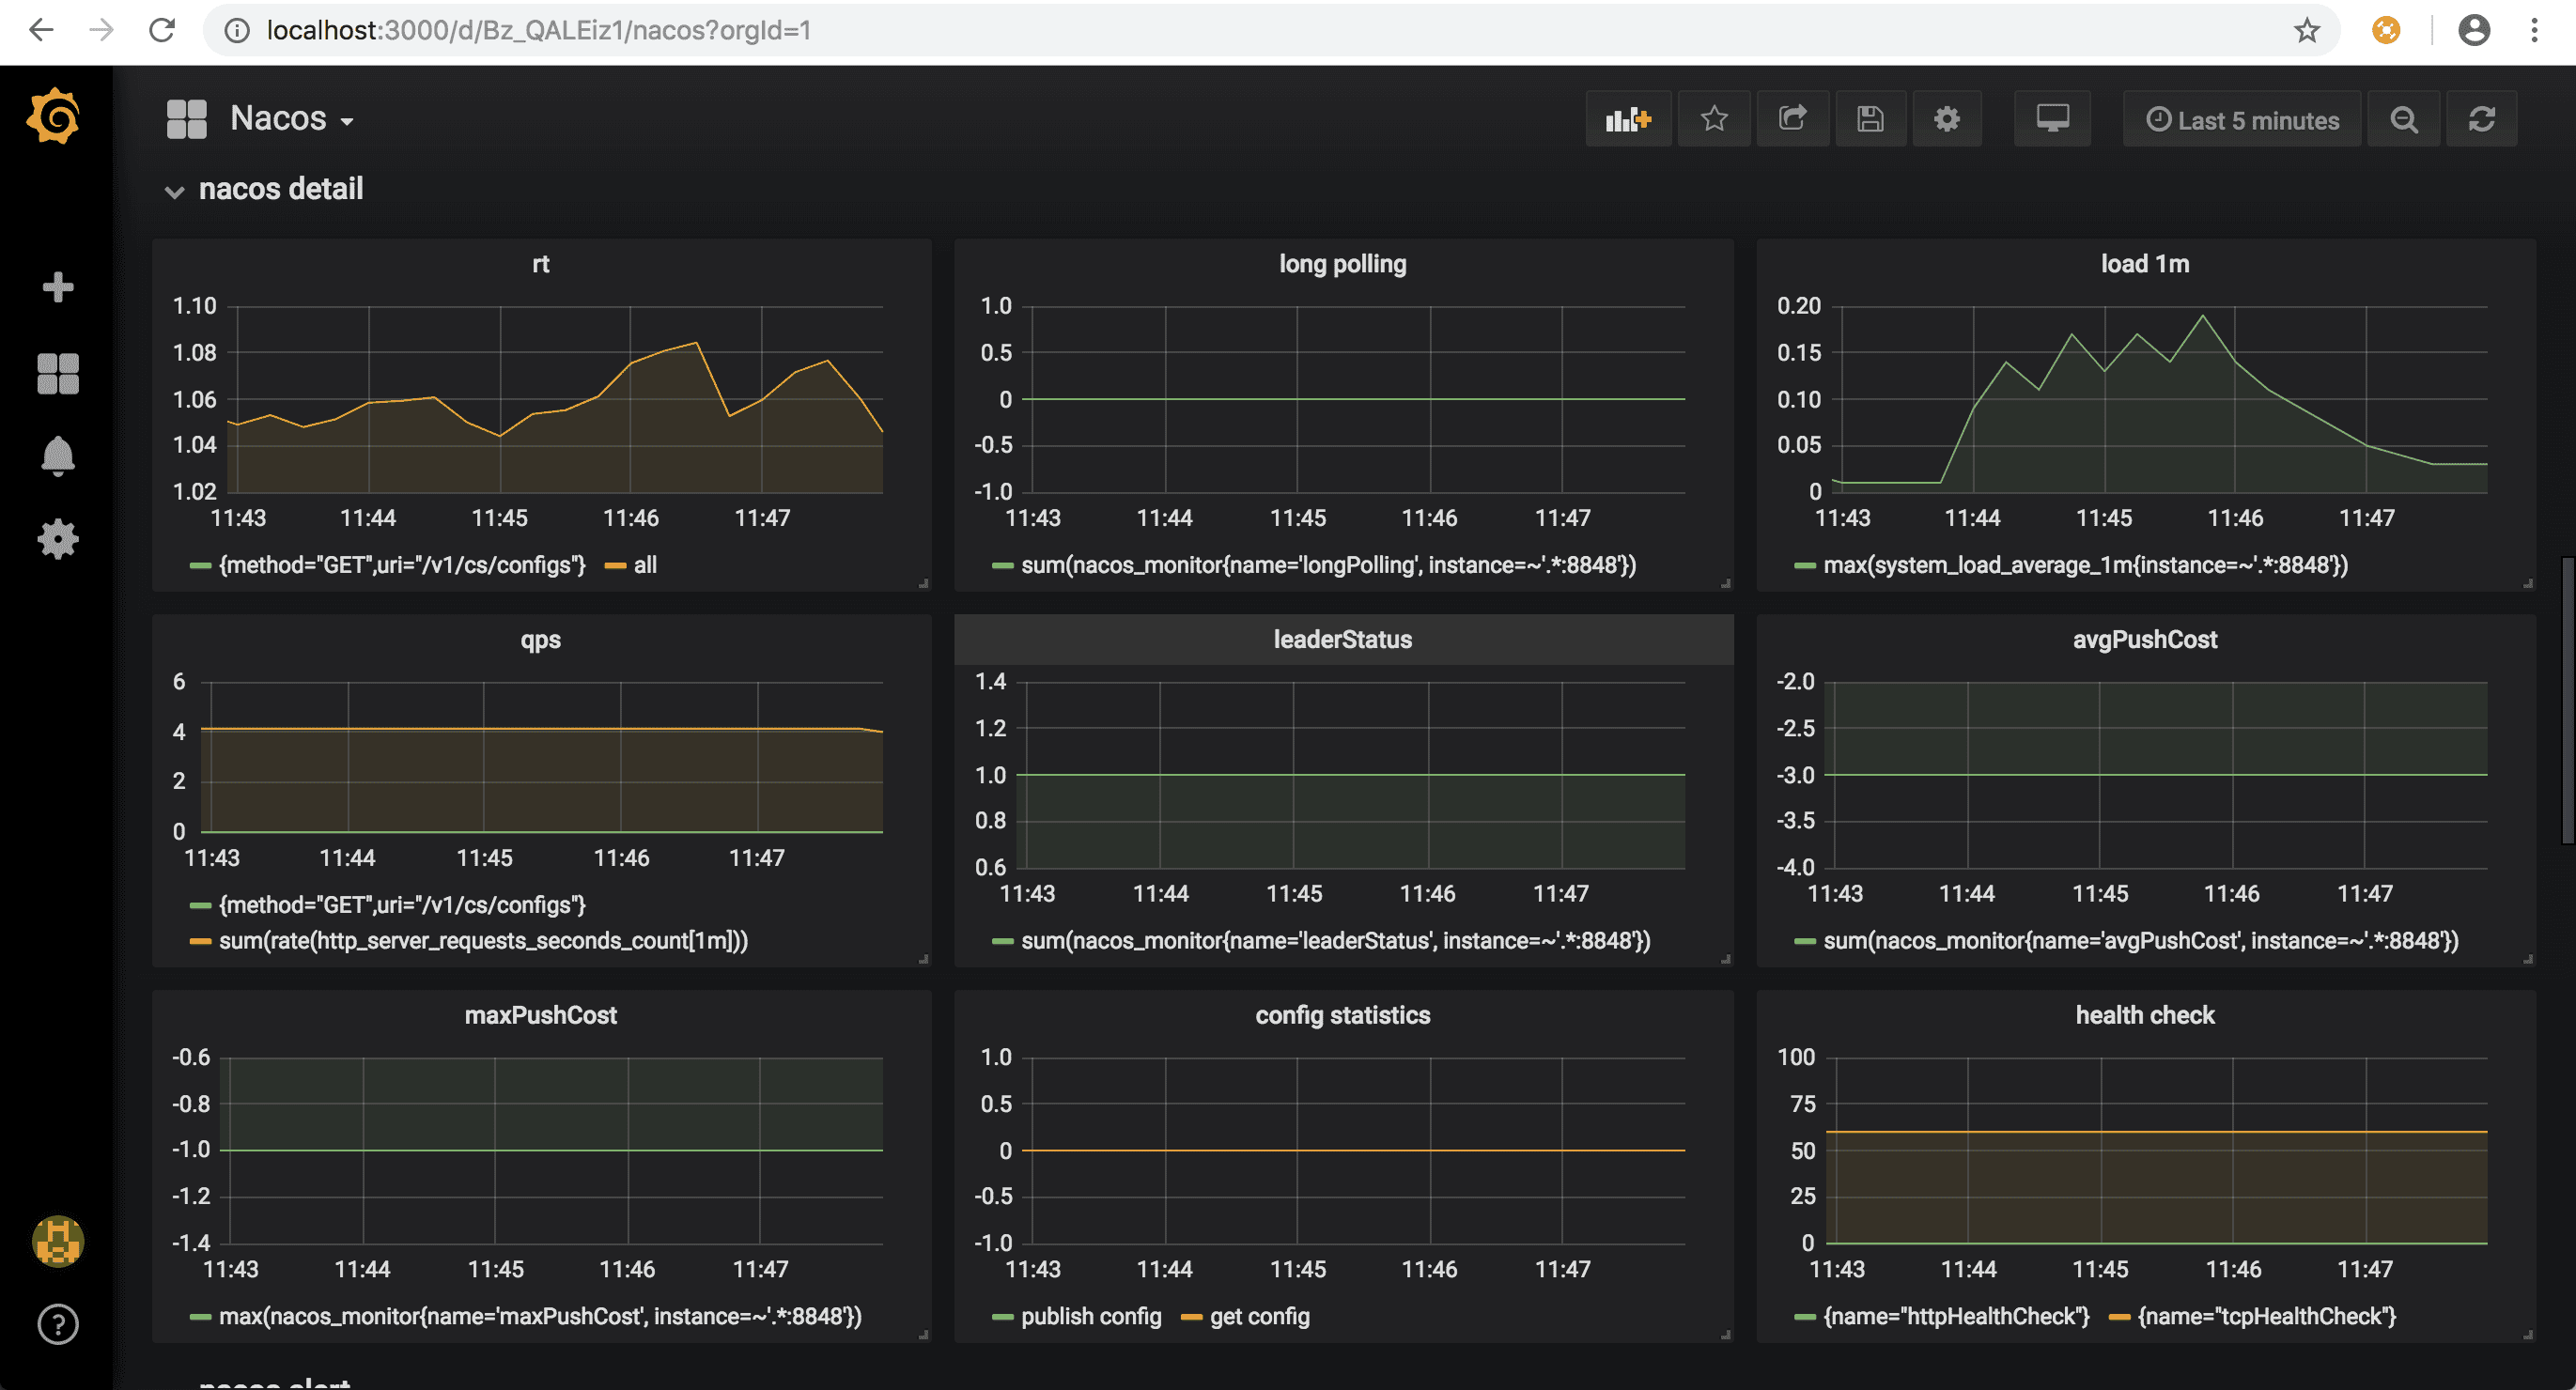
- nacos alert为告警项
配置grafana告警
当Nacos运行出现问题时,需要grafana告警通知相关负责人。grafana支持多种告警方式,常用的有邮件,钉钉和webhook方式
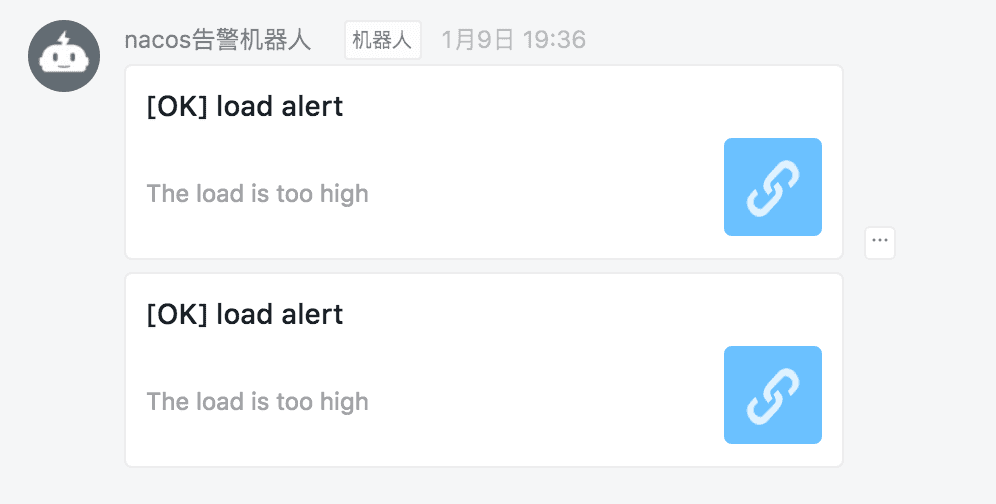
钉钉告警
钉钉可以通过配置钉钉机器人
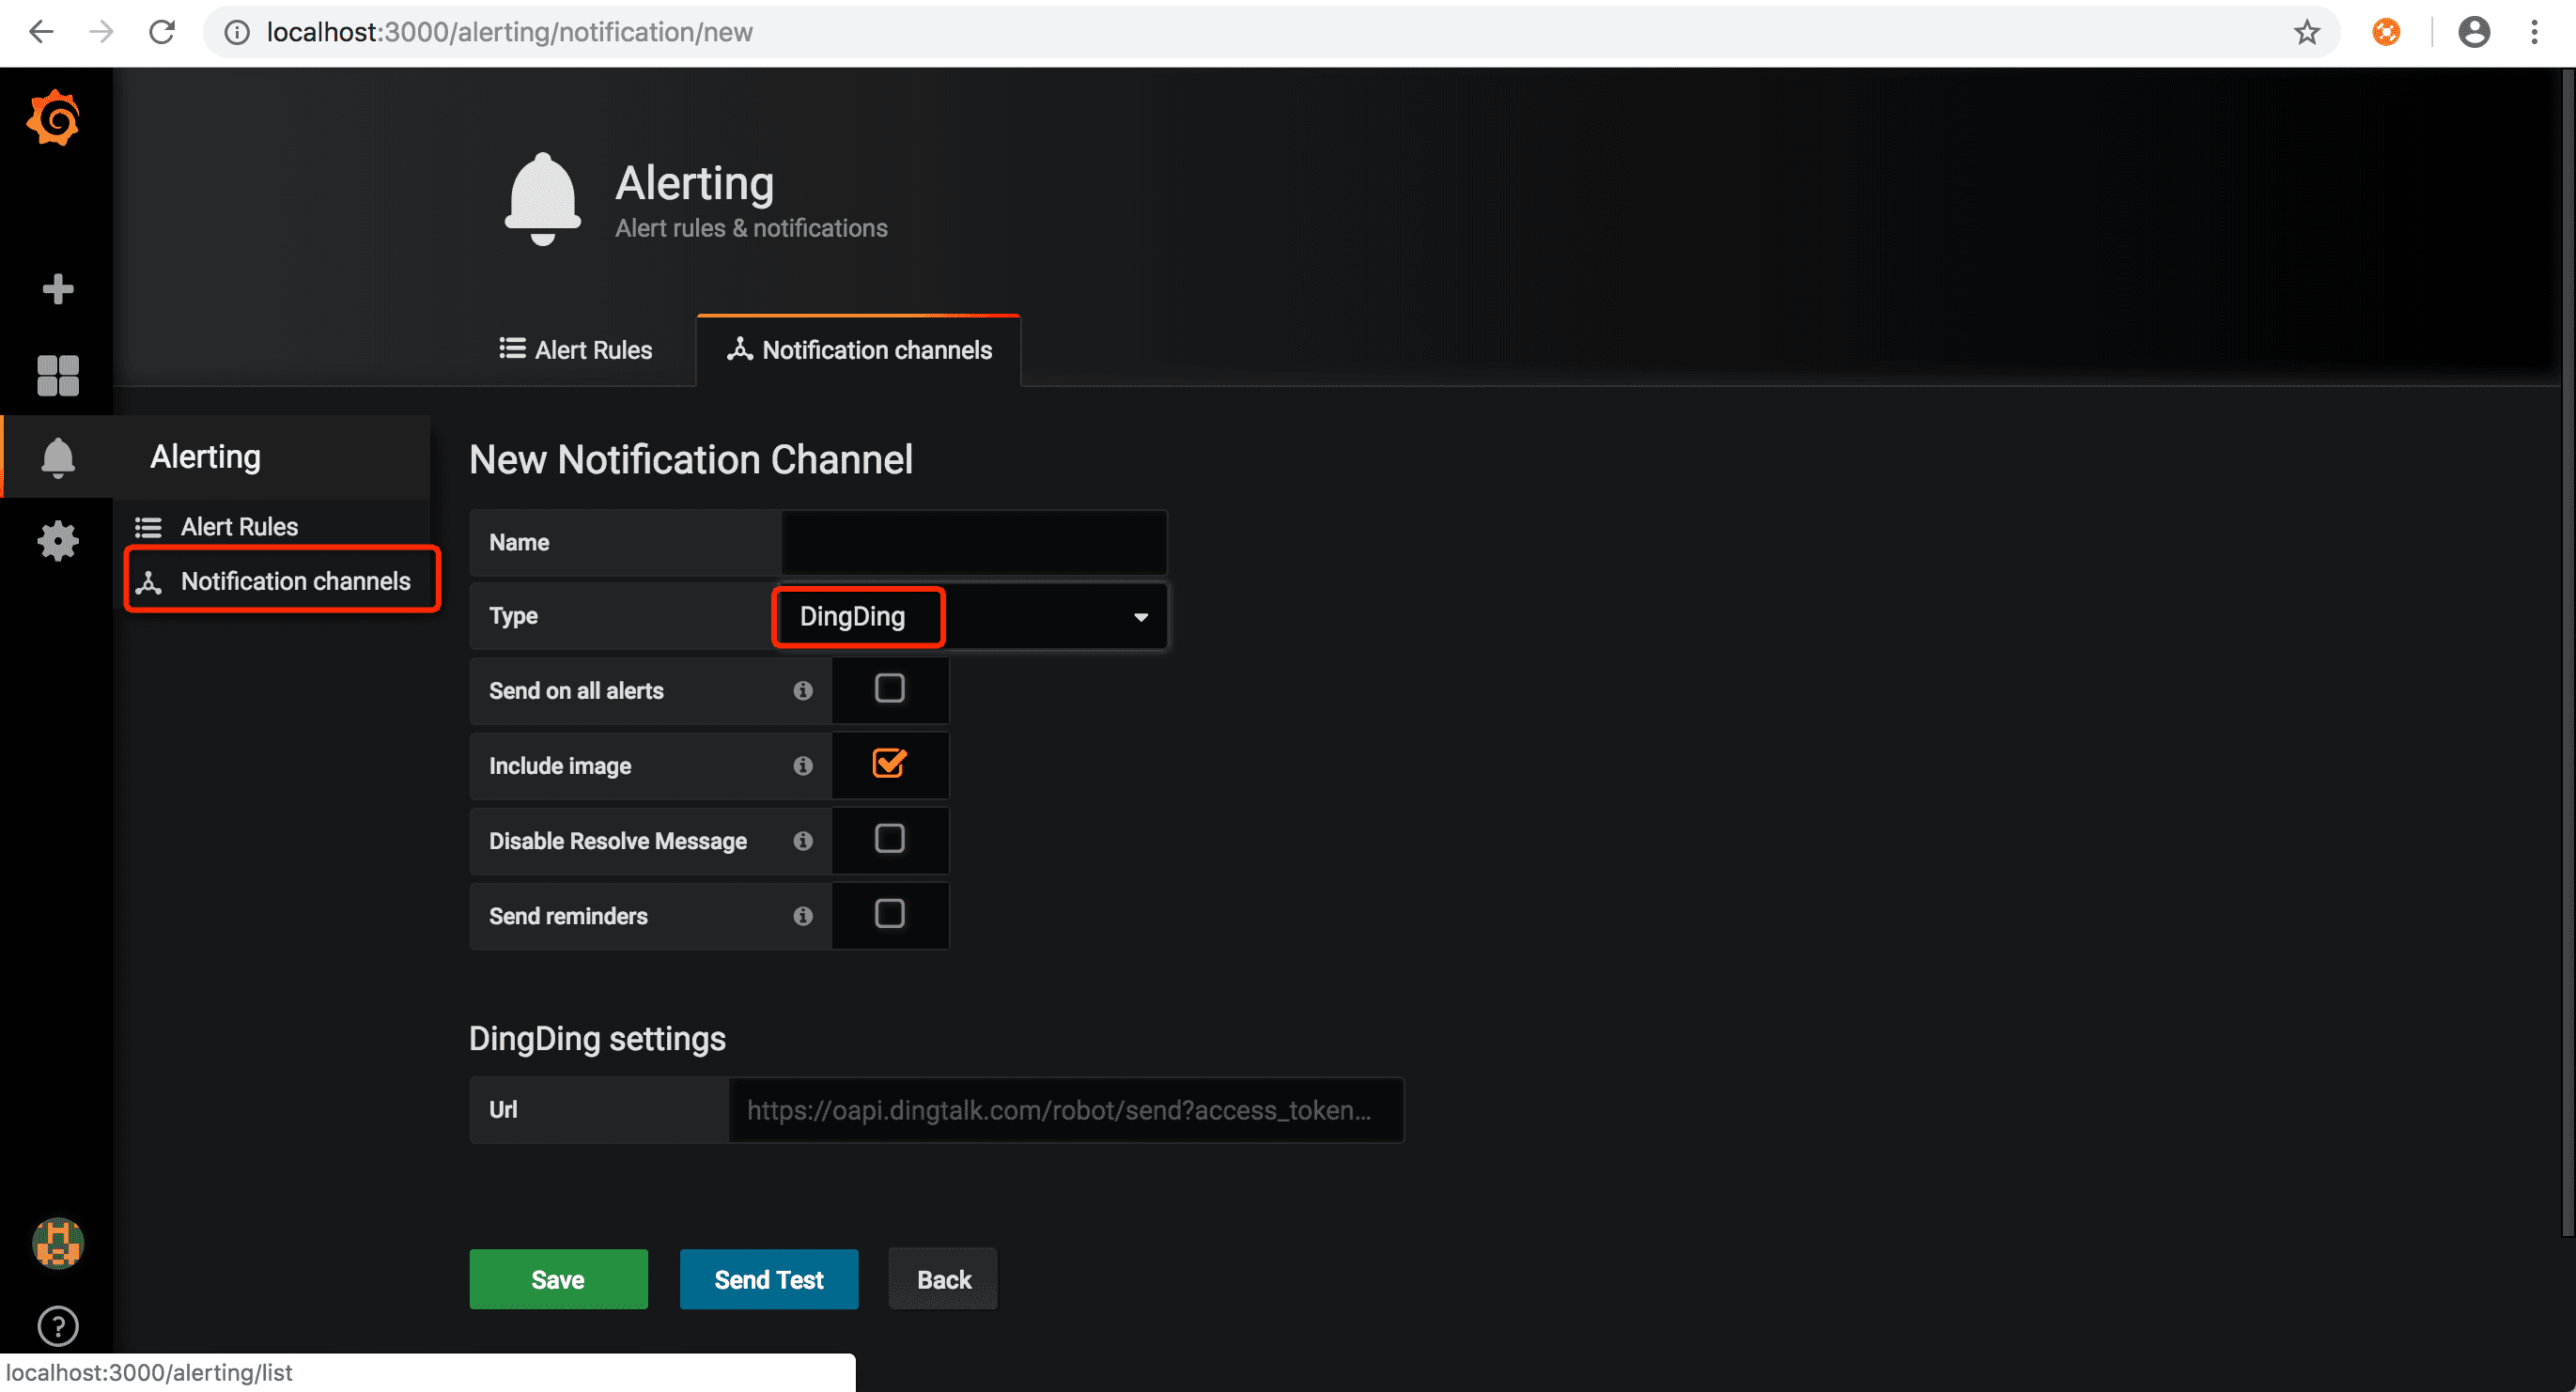
配置钉钉通知url
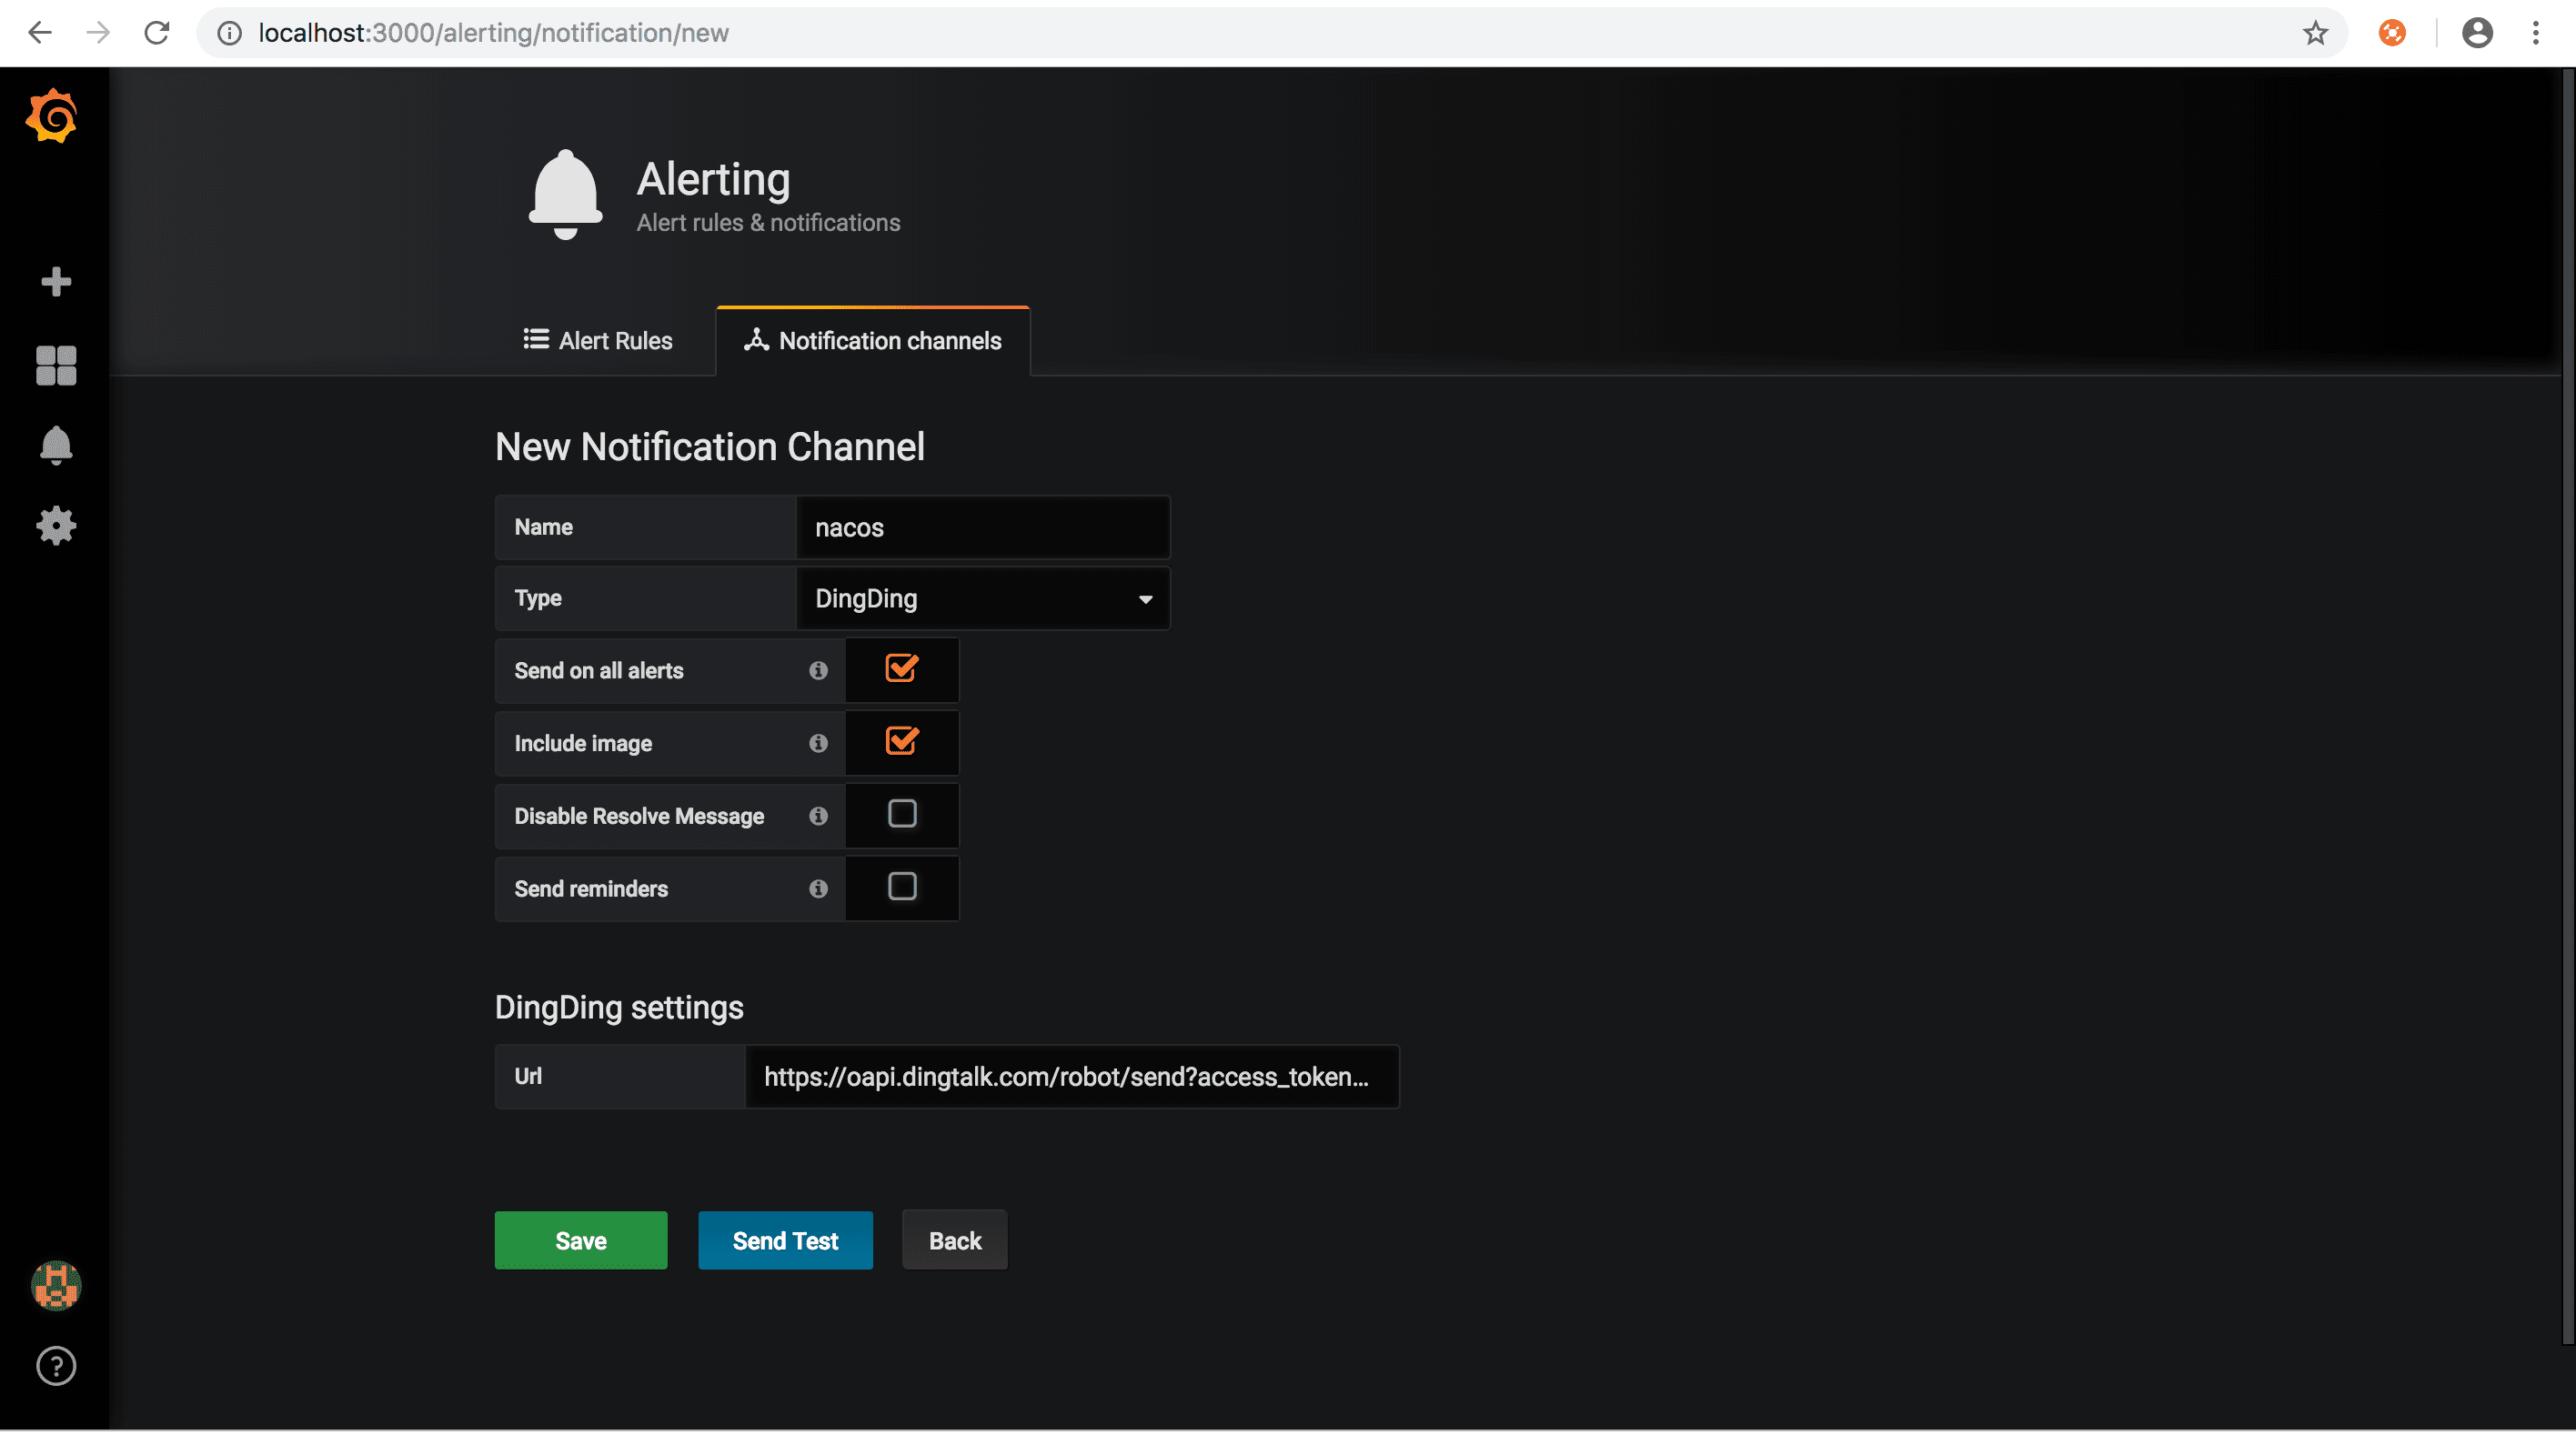
测试告警项
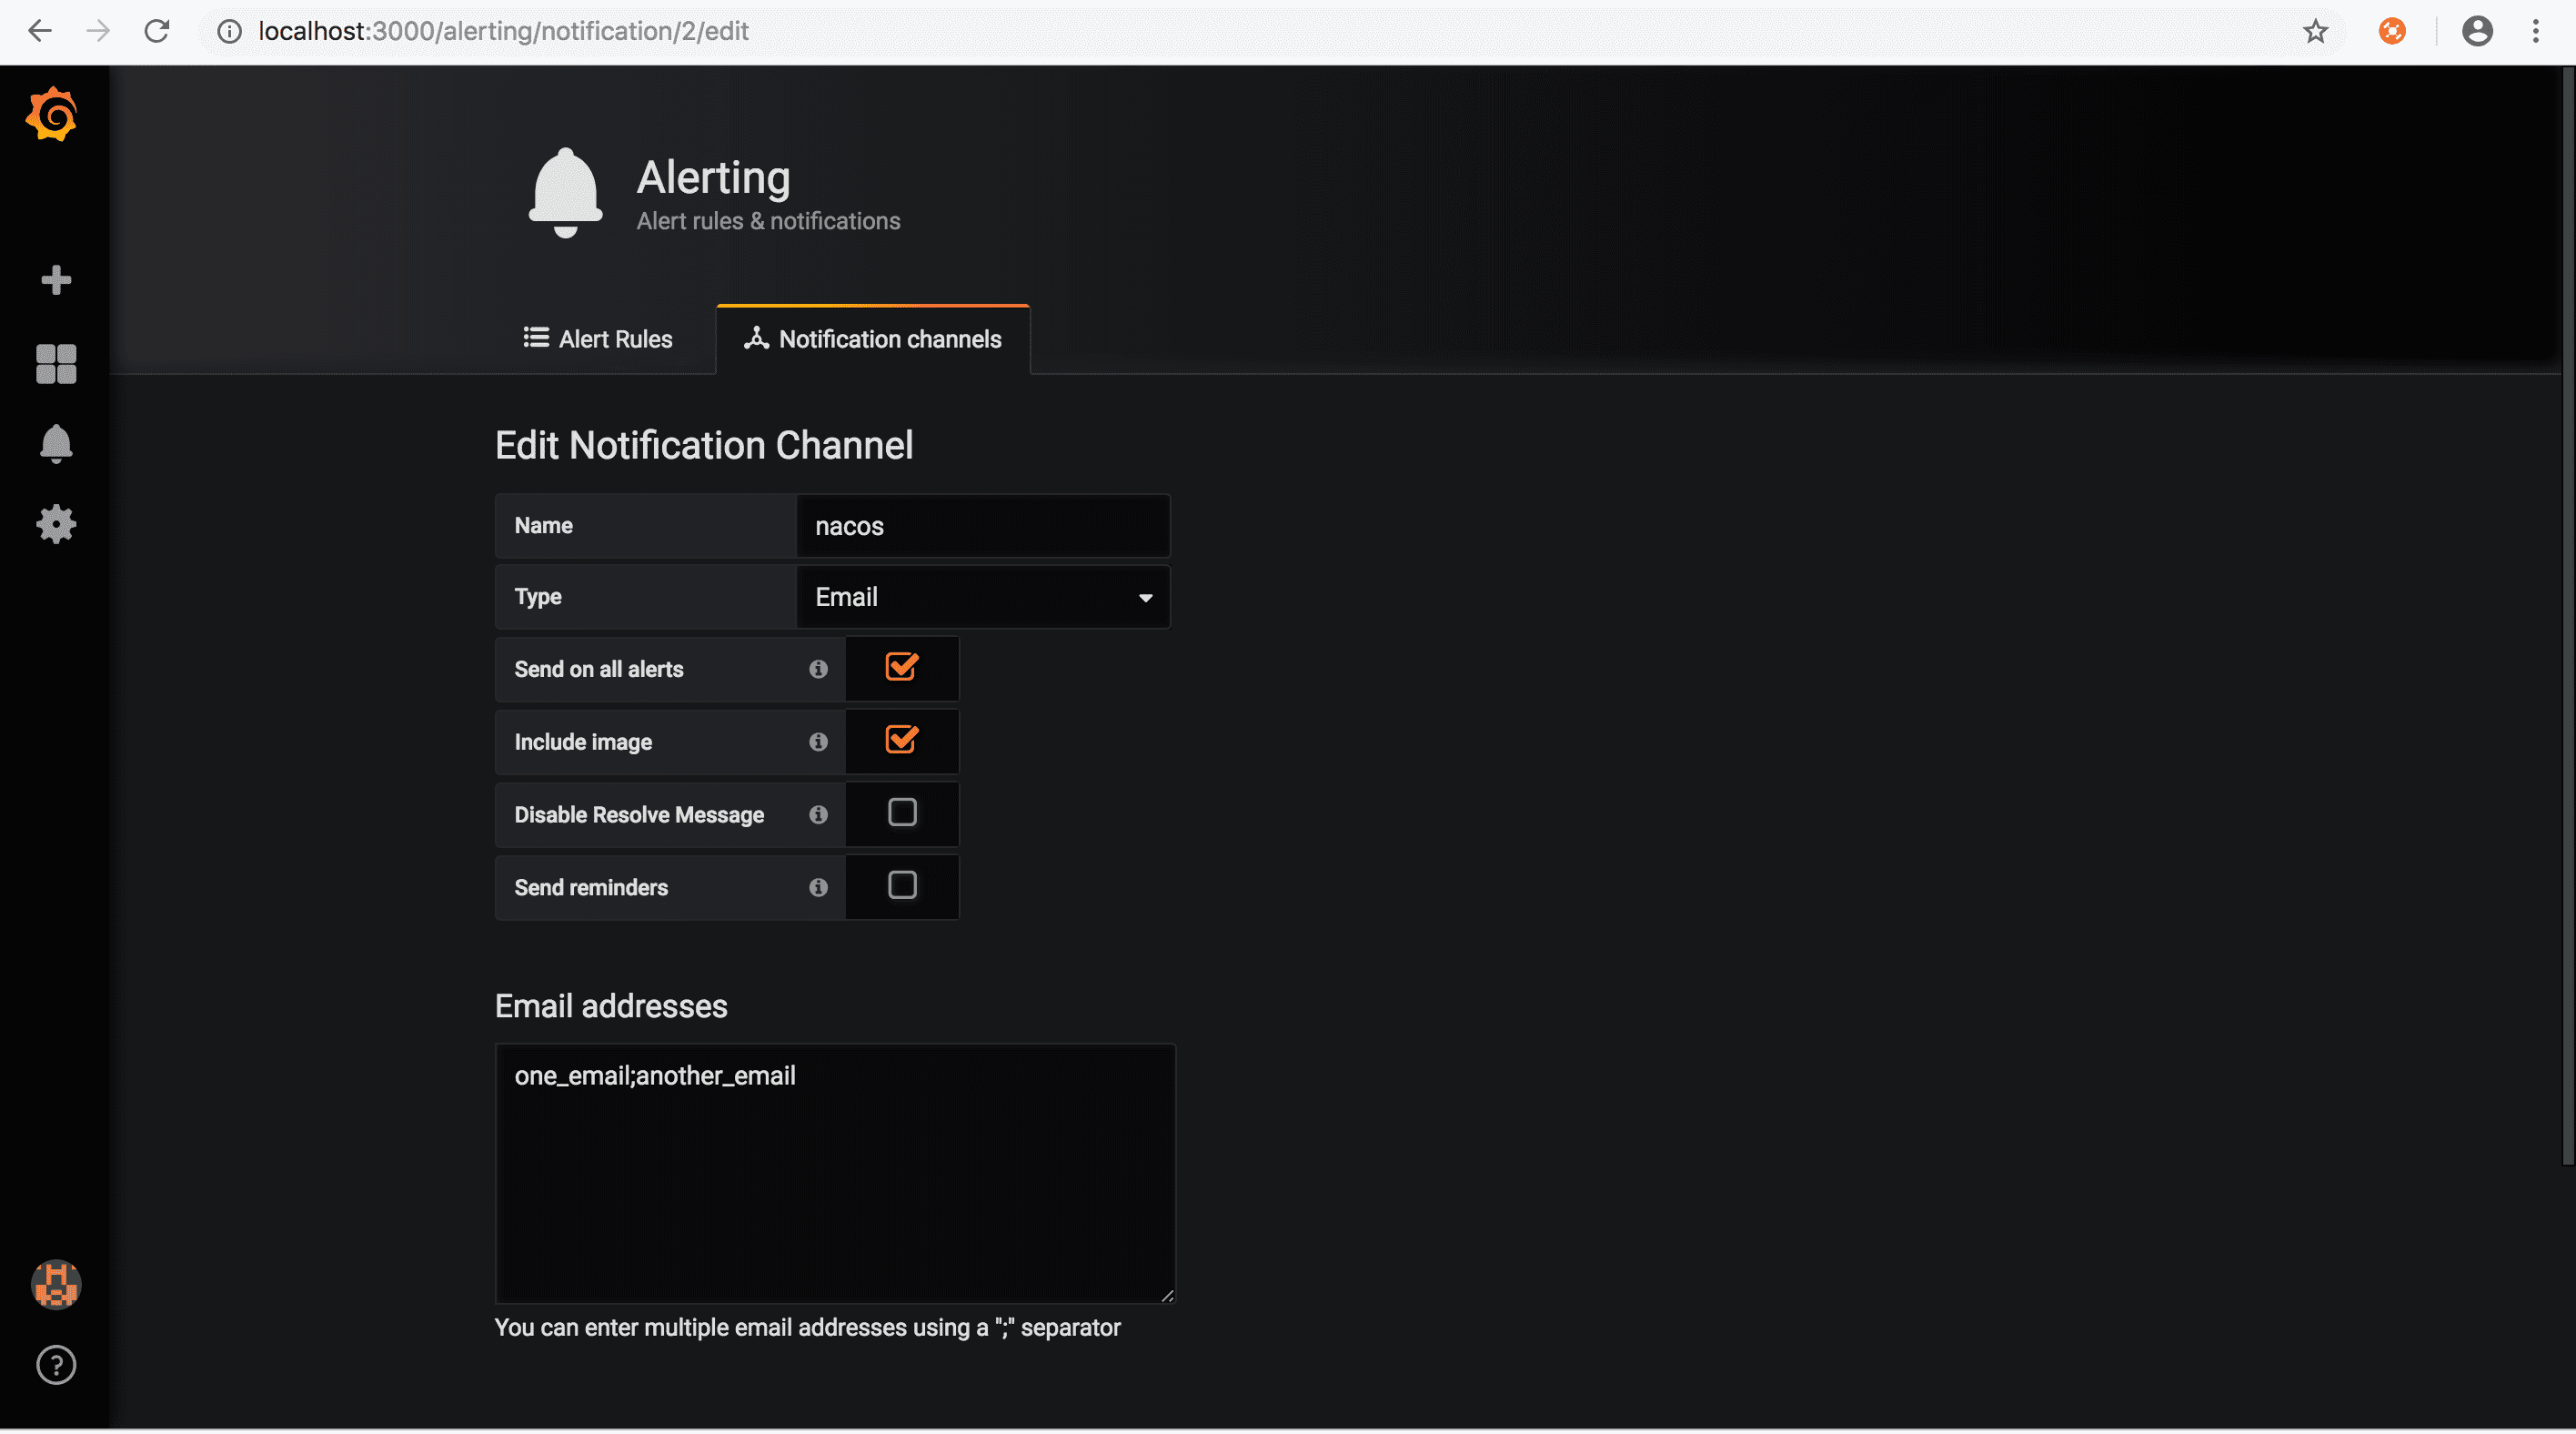
邮件告警
修改defaults.ini配置文件,增加邮件告警
#################################### SMTP / Emailing ##########################
[smtp]
enabled = true
host = smtp.126.com:25
user = xxxxxx
password = xxxxx
;cert_file =
;key_file =
skip_verify = true
from_address = xxxxxx@126.com

[emails]
;welcome_email_on_sign_up = false
配置通知邮箱
Nacos metrics含义
jvm metrics
| 指标 | 含义 |
|---|---|
| system_cpu_usage | CPU使用率 |
| system_load_average_1m | load |
| jvm_memory_used_bytes | 内存使用字节,包含各种内存区 |
| jvm_memory_max_bytes | 内存最大字节,包含各种内存区 |
| jvm_gc_pause_seconds_count | gc次数,包含各种gc |
| jvm_gc_pause_seconds_sum | gc耗时,包含各种gc |
| jvm_threads_daemon | 线程数 |
Nacos 监控指标
| 指标 | 含义 |
|---|---|
| http_server_requests_seconds_count | http请求次数,包括多种(url,方法,code) |
| http_server_requests_seconds_sum | http请求总耗时,包括多种(url,方法,code) |
| nacos_timer_seconds_sum | Nacos config水平通知耗时 |
| nacos_timer_seconds_count | Nacos config水平通知次数 |
| nacos_monitor{name='longPolling'} | Nacos config长连接数 |
| nacos_monitor{name='configCount'} | Nacos config配置个数 |
| nacos_monitor{name='dumpTask'} | Nacos config配置落盘任务堆积数 |
| nacos_monitor{name='notifyTask'} | Nacos config配置水平通知任务堆积数 |
| nacos_monitor{name='getConfig'} | Nacos config读配置统计数 |
| nacos_monitor{name='publish'} | Nacos config写配置统计数 |
| nacos_monitor{name='ipCount'} | Nacos naming ip个数 |
| nacos_monitor{name='domCount'} | Nacos naming域名个数(1.x 版本) |
| nacos_monitor{name='serviceCount'} | Nacos naming域名个数(2.x 版本) |
| nacos_monitor{name='failedPush'} | Nacos naming推送失败数 |
| nacos_monitor{name='avgPushCost'} | Nacos naming平均推送耗时 |
| nacos_monitor{name='leaderStatus'} | Nacos naming角色状态 |
| nacos_monitor{name='maxPushCost'} | Nacos naming最大推送耗时 |
| nacos_monitor{name='mysqlhealthCheck'} | Nacos naming mysql健康检查次数 |
| nacos_monitor{name='httpHealthCheck'} | Nacos naming http健康检查次数 |
| nacos_monitor{name='tcpHealthCheck'} | Nacos naming tcp健康检查次数 |
nacos 异常指标
| 指标 | 含义 |
|---|---|
| nacos_exception_total{name='db'} | 数据库异常 |
| nacos_exception_total{name='configNotify'} | Nacos config水平通知失败 |
| nacos_exception_total{name='unhealth'} | Nacos config server之间健康检查异常 |
| nacos_exception_total{name='disk'} | Nacos naming写磁盘异常 |
| nacos_exception_total{name='leaderSendBeatFailed'} | Nacos naming leader发送心跳异常 |
| nacos_exception_total{name='illegalArgument'} | 请求参数不合法 |
| nacos_exception_total{name='nacos'} | Nacos请求响应内部错误异常(读写失败,没权限,参数错误) |
client metrics
| 指标 | 含义 |
|---|---|
| nacos_monitor{name='subServiceCount'} | 订阅的服务数 |
| nacos_monitor{name='pubServiceCount'} | 发布的服务数 |
| nacos_monitor{name='configListenSize'} | 监听的配置数 |
| nacos_client_request_seconds_count | 请求的次数,包括多种(url,方法,code) |
| nacos_client_request_seconds_sum | 请求的总耗时,包括多种(url,方法,code) |
Nacos-Sync监控
随着Nacos 0.9版本发布,Nacos-Sync 0.3版本支持了metrics监控,能通过metrics数据观察Nacos-Sync服务的运行状态,提升了Nacos-Sync的在生产环境的监控能力。 整体的监控体系的搭建参考Nacos监控手册
grafana监控Nacos-Sync
和Nacos监控一样,Nacos-Sync也提供了监控模版,导入监控模版
Nacos-Sync监控同样也分为三个模块:
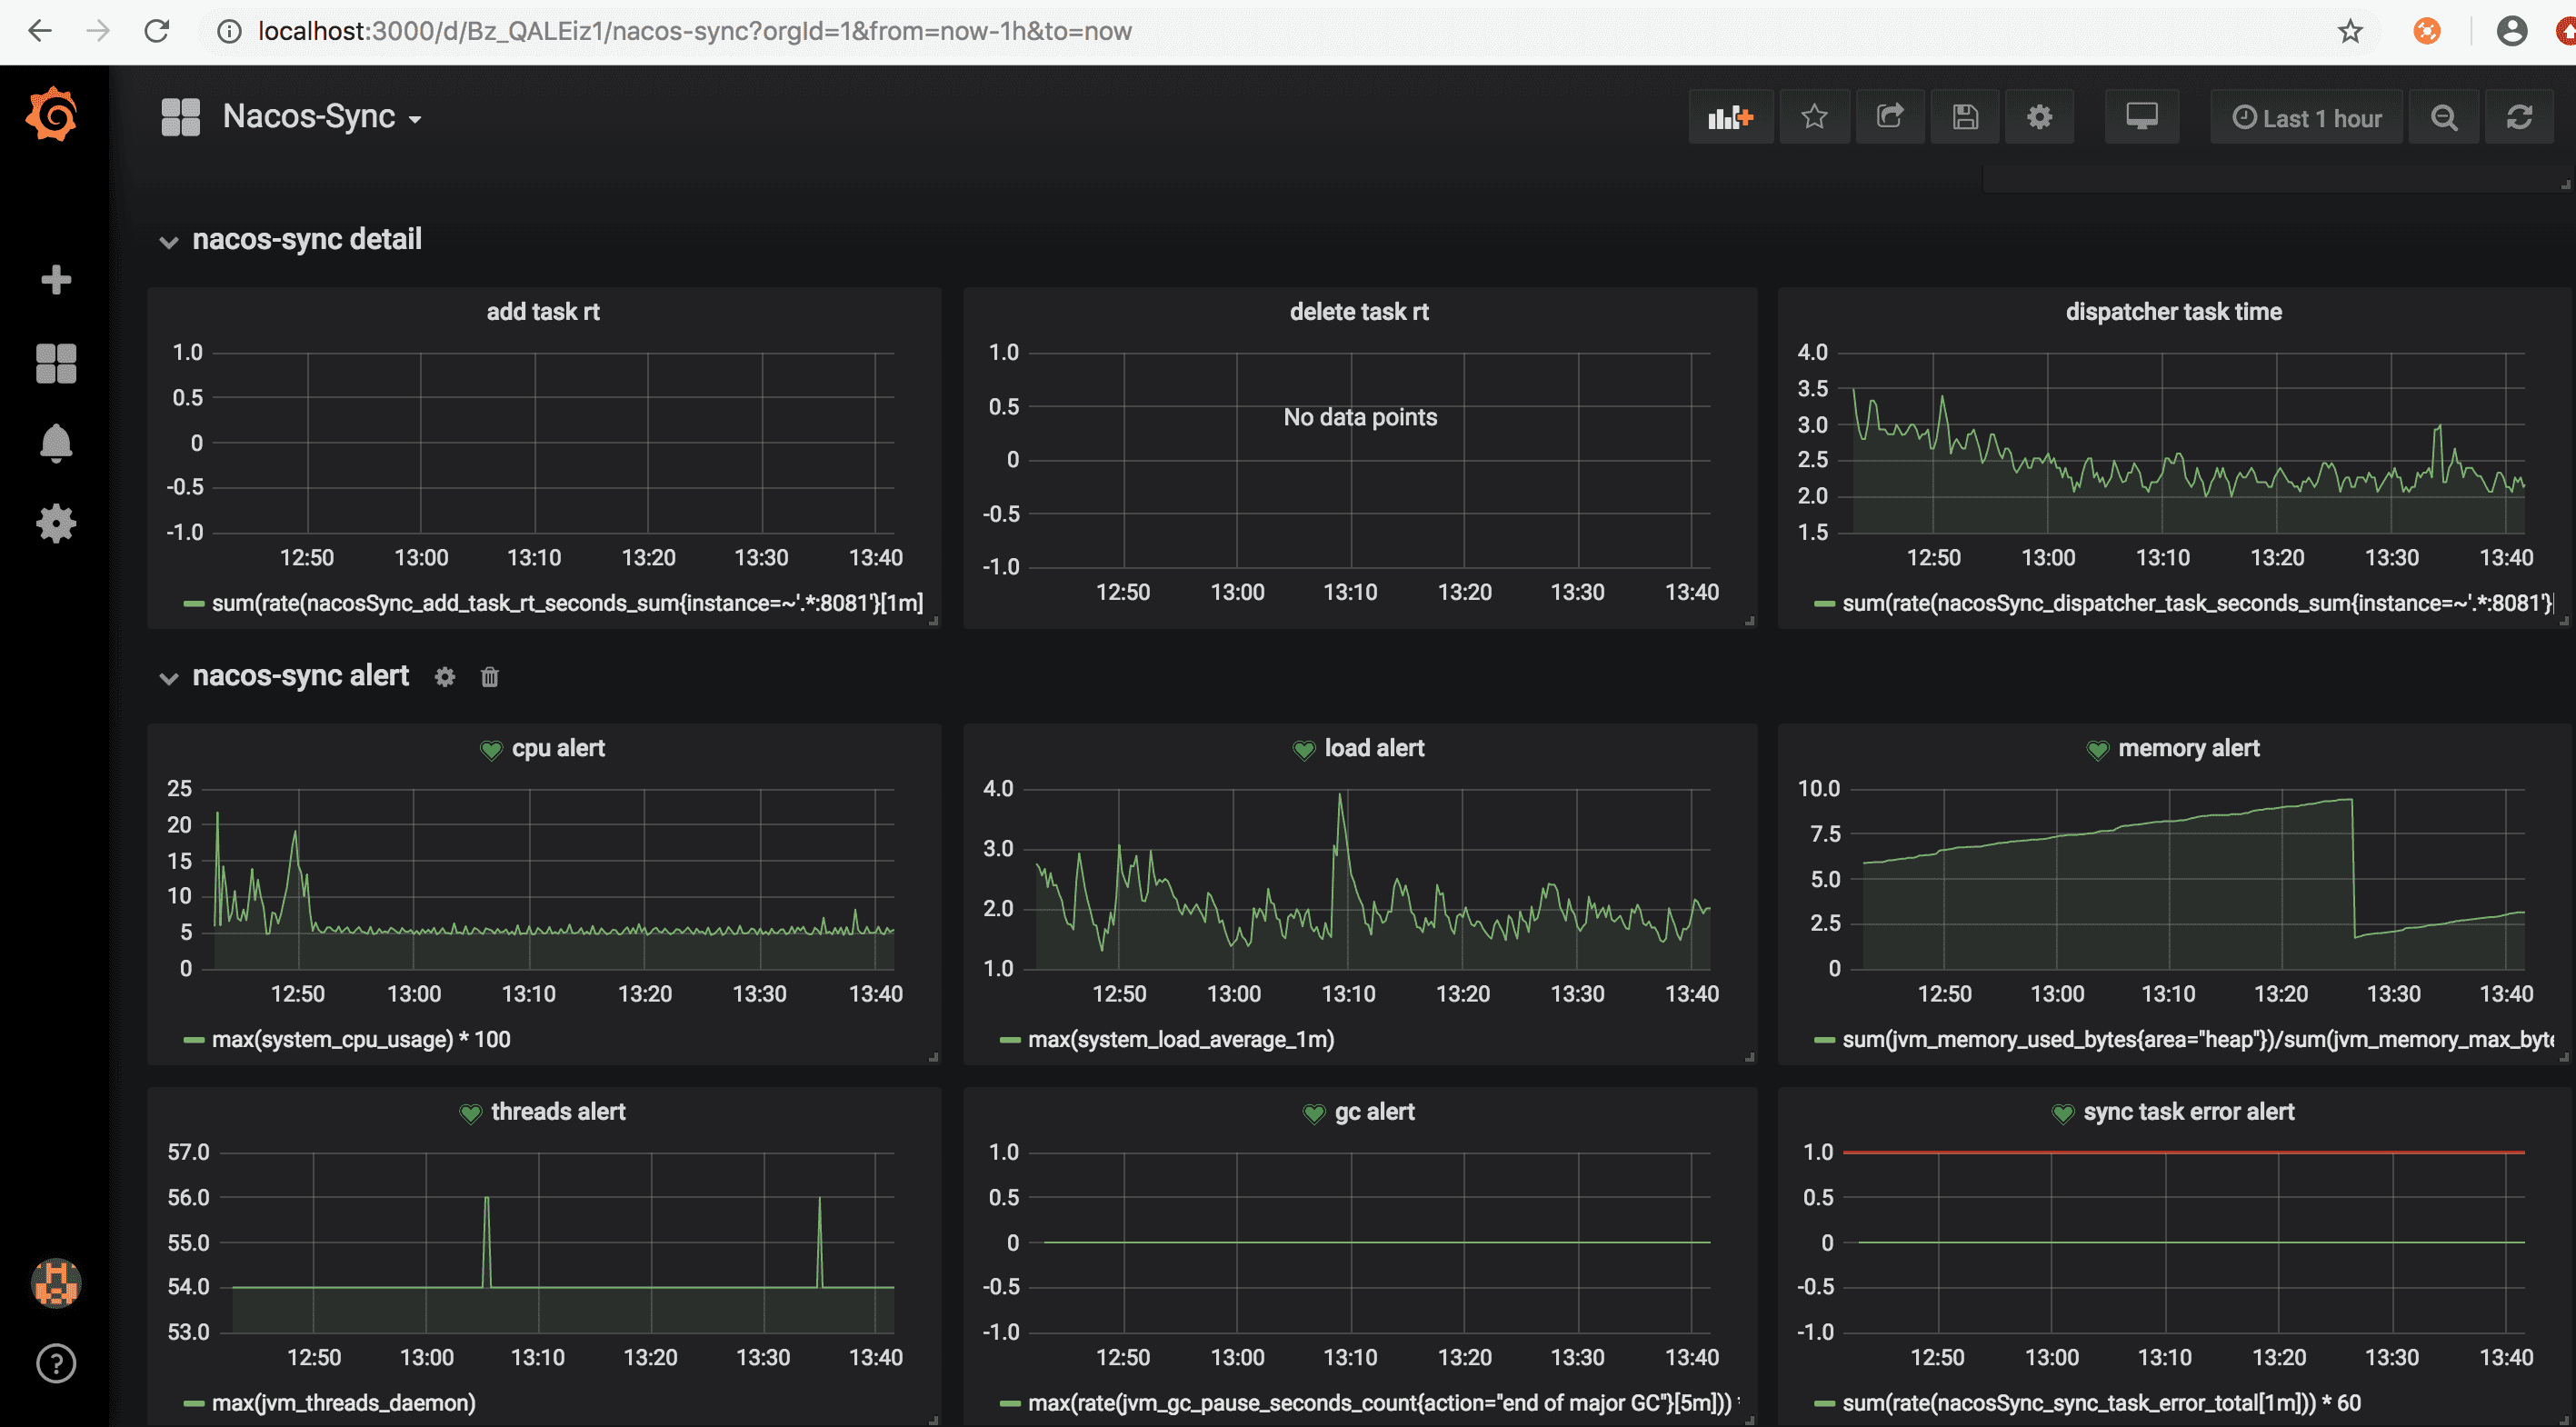
- nacos-sync monitor展示核心监控项
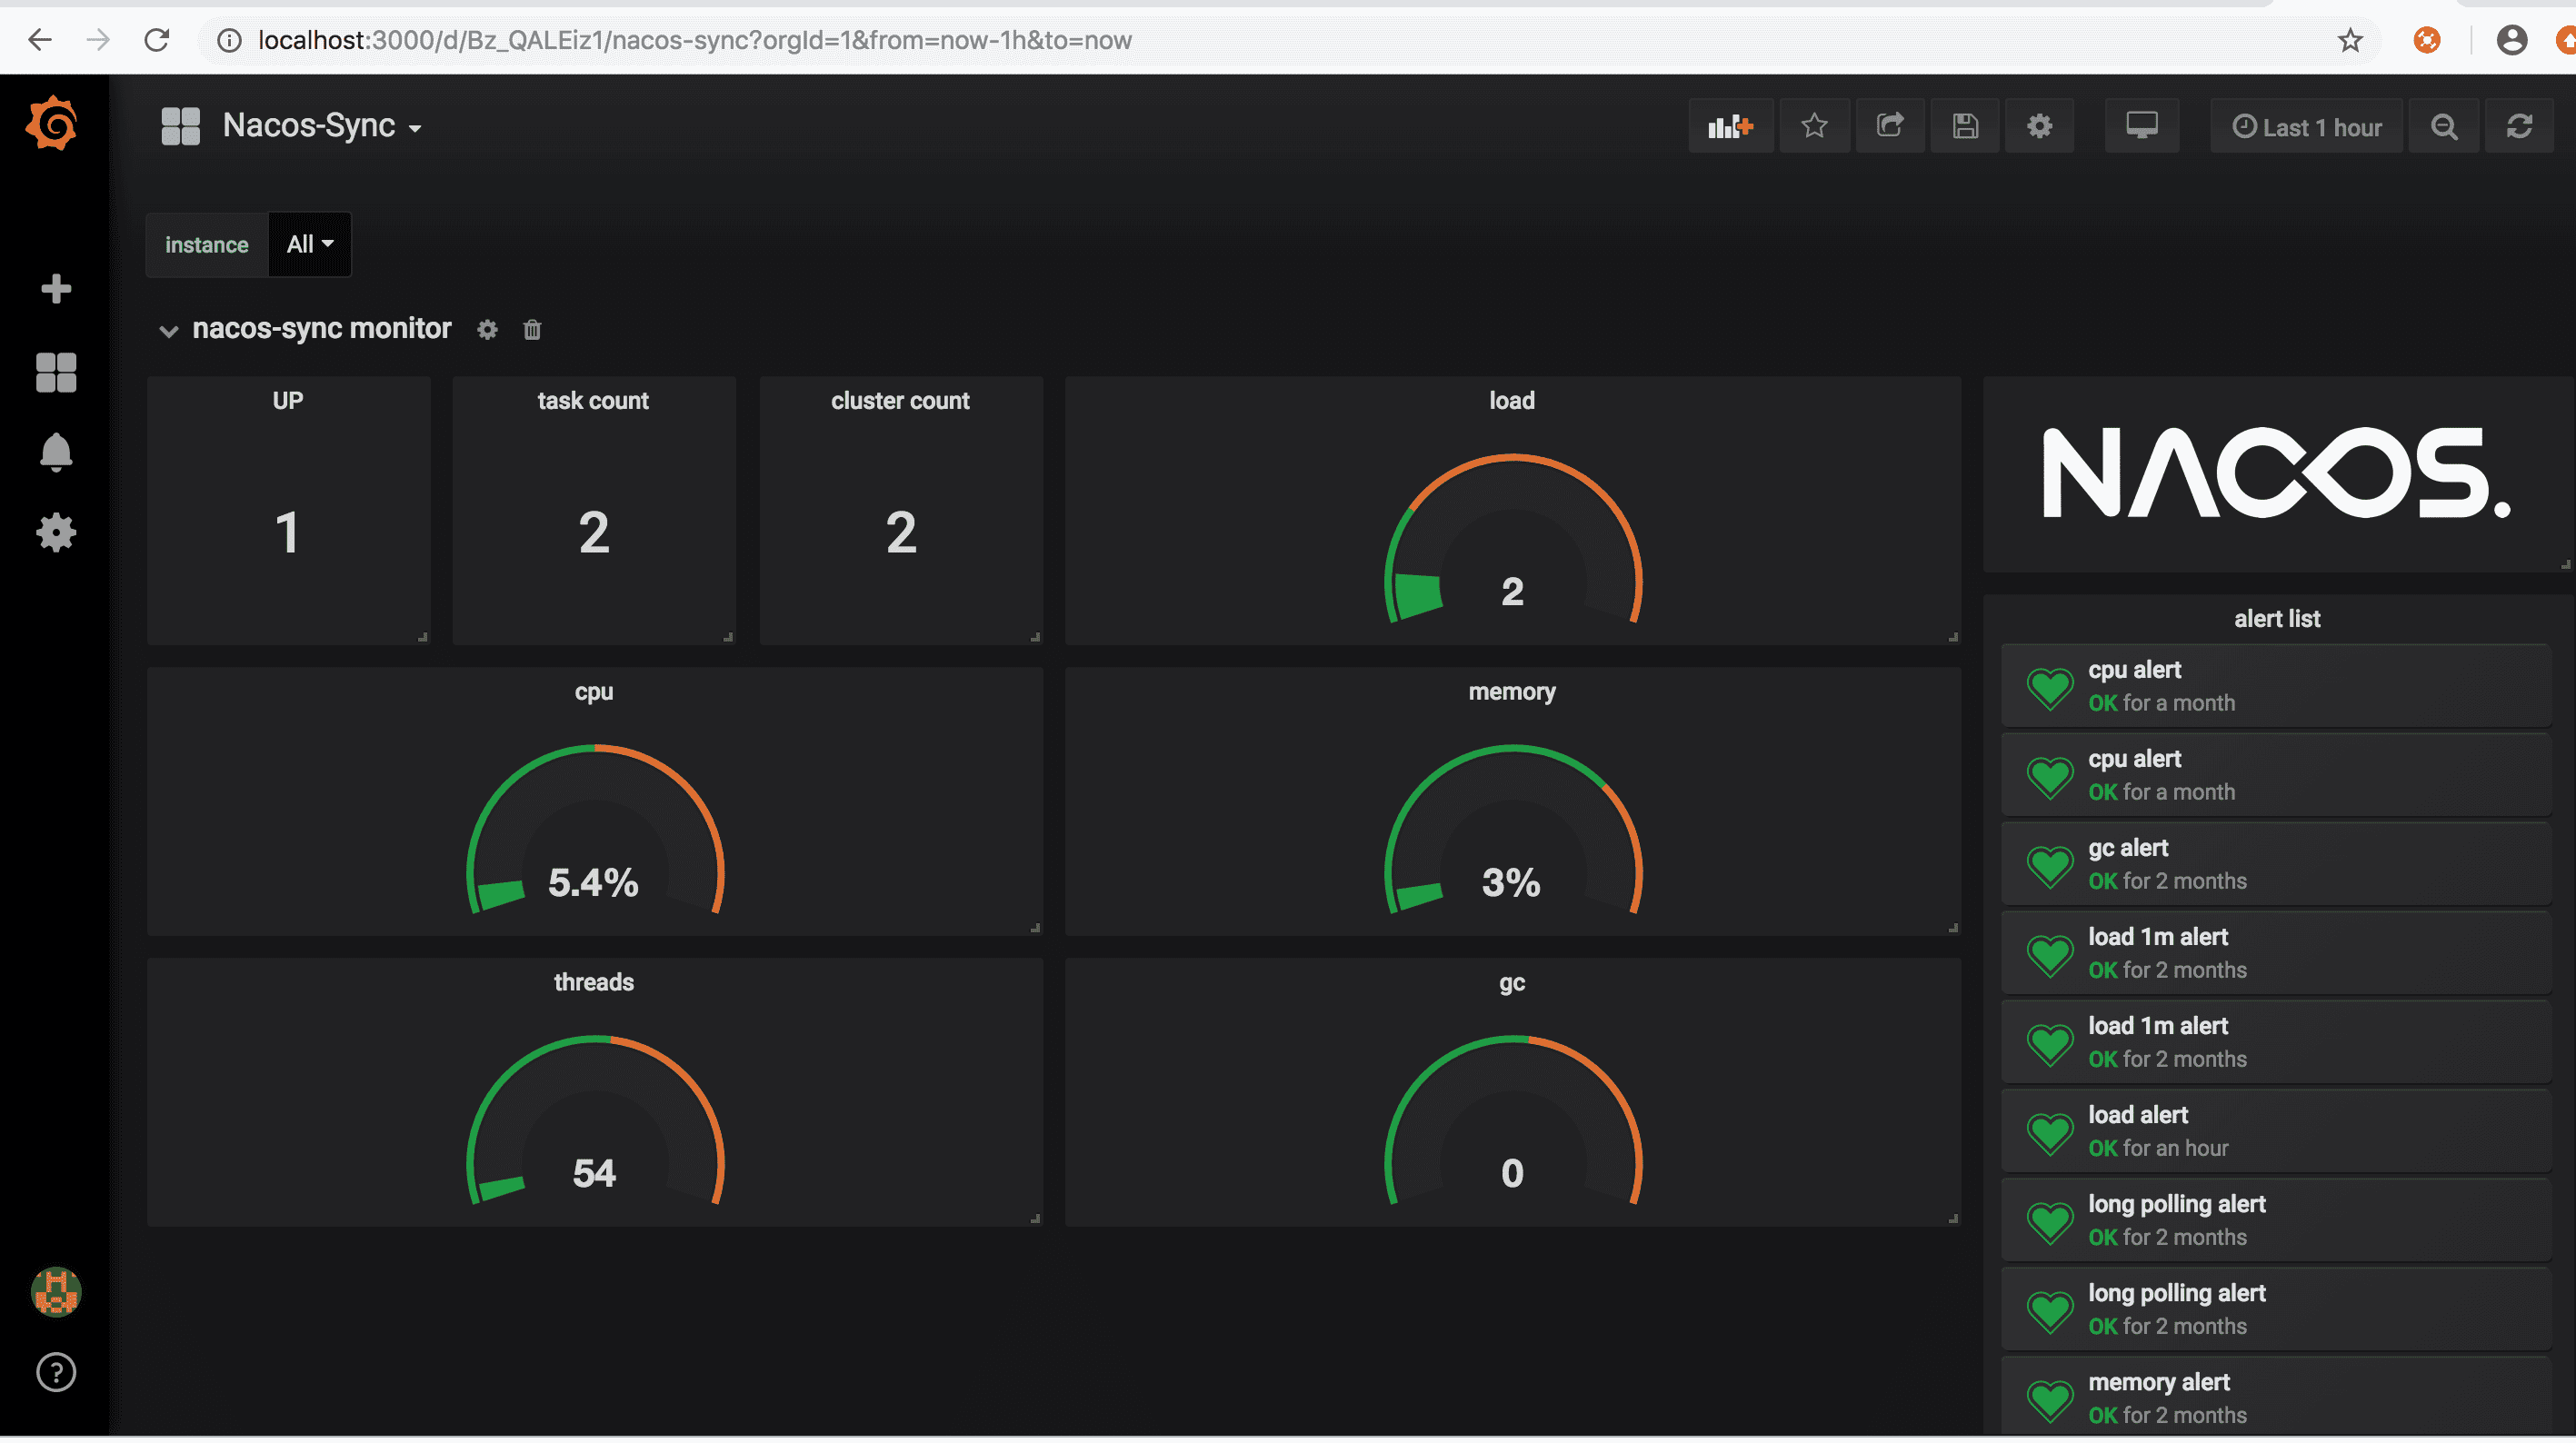
- nacos-sync detail和alert展示监控曲线和告警
Nacos-Sync metrics含义
Nacos-Sync的metrics分为jvm层和应用层
jvm metrics
| 指标 | 含义 |
|---|---|
| system_cpu_usage | CPU使用率 |
| system_load_average_1m | load |
| jvm_memory_used_bytes | 内存使用字节,包含各种内存区 |
| jvm_memory_max_bytes | 内存最大字节,包含各种内存区 |
| jvm_gc_pause_seconds_count | gc次数,包含各种gc |
| jvm_gc_pause_seconds_sum | gc耗时,包含各种gc |
| jvm_threads_daemon | 线程数 |
应用层 metrics
| 指标 | 含义 |
|---|---|
| nacosSync_task_size | 同步任务数 |
| nacosSync_cluster_size | 集群数 |
| nacosSync_add_task_rt | 同步任务执行耗时 |
| nacosSync_delete_task_rt | 删除任务耗时 |
| nacosSync_dispatcher_task | 从数据库中分发任务 |
| nacosSync_sync_task_error | 所有同步执行时的异常 |


 9205
9205

 被折叠的 条评论
为什么被折叠?
被折叠的 条评论
为什么被折叠?
 到【灌水乐园】发言


