


在坐标区中显示图片

1.右键坐标区,点击编辑器

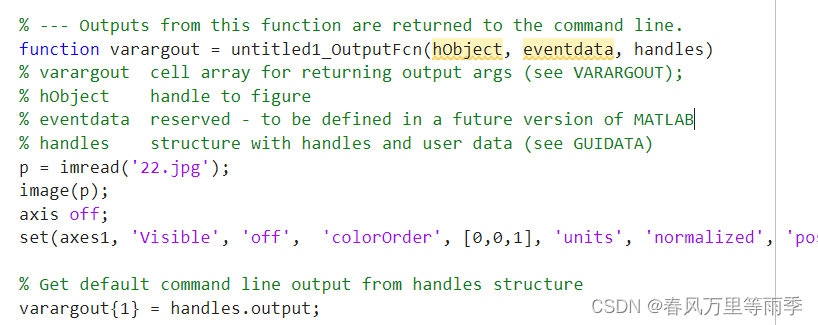
2.在回调函数中修改代码,添加图片
% --- Outputs from this function are returned to the command line.
function varargout = untitled1_OutputFcn(hObject, eventdata, handles)
% varargout cell array for returning output args (see VARARGOUT);
% hObject handle to figure
% eventdata reserved - to be defined in a future version of MATLAB
% handles structure with handles and user data (see GUIDATA)
p = imread('22.jpg');
image(p);
axis off;%隐藏坐标轴
set(axes1, 'Visible', 'off', 'colorOrder', [0,0,1], 'units', 'normalized', 'position', [0 0 1 1]);
%上述代码将图片放到axes1中显示
% Get default command line output from handles structure
varargout{1} = handles.output;
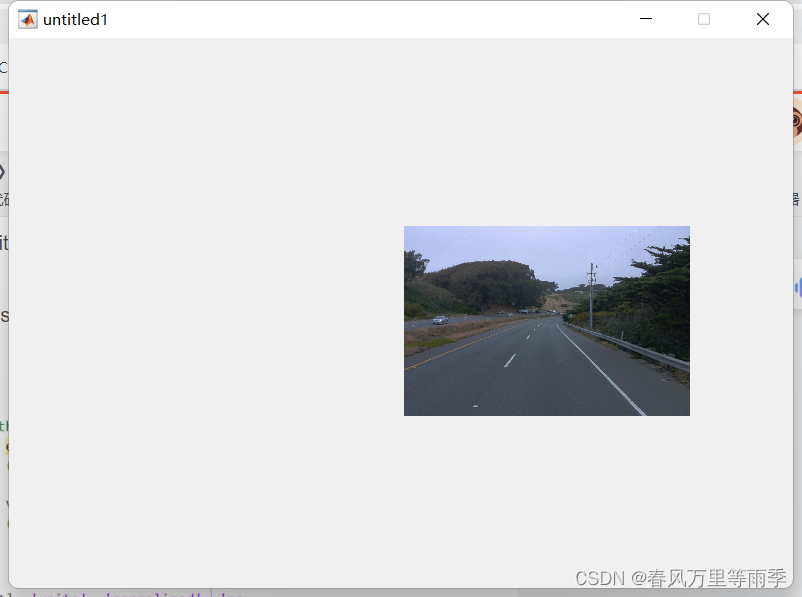
运行代码(下图中图片的位置可由axse1的位置调整)


 533
533


 被折叠的 条评论
为什么被折叠?
被折叠的 条评论
为什么被折叠?
 到【灌水乐园】发言


