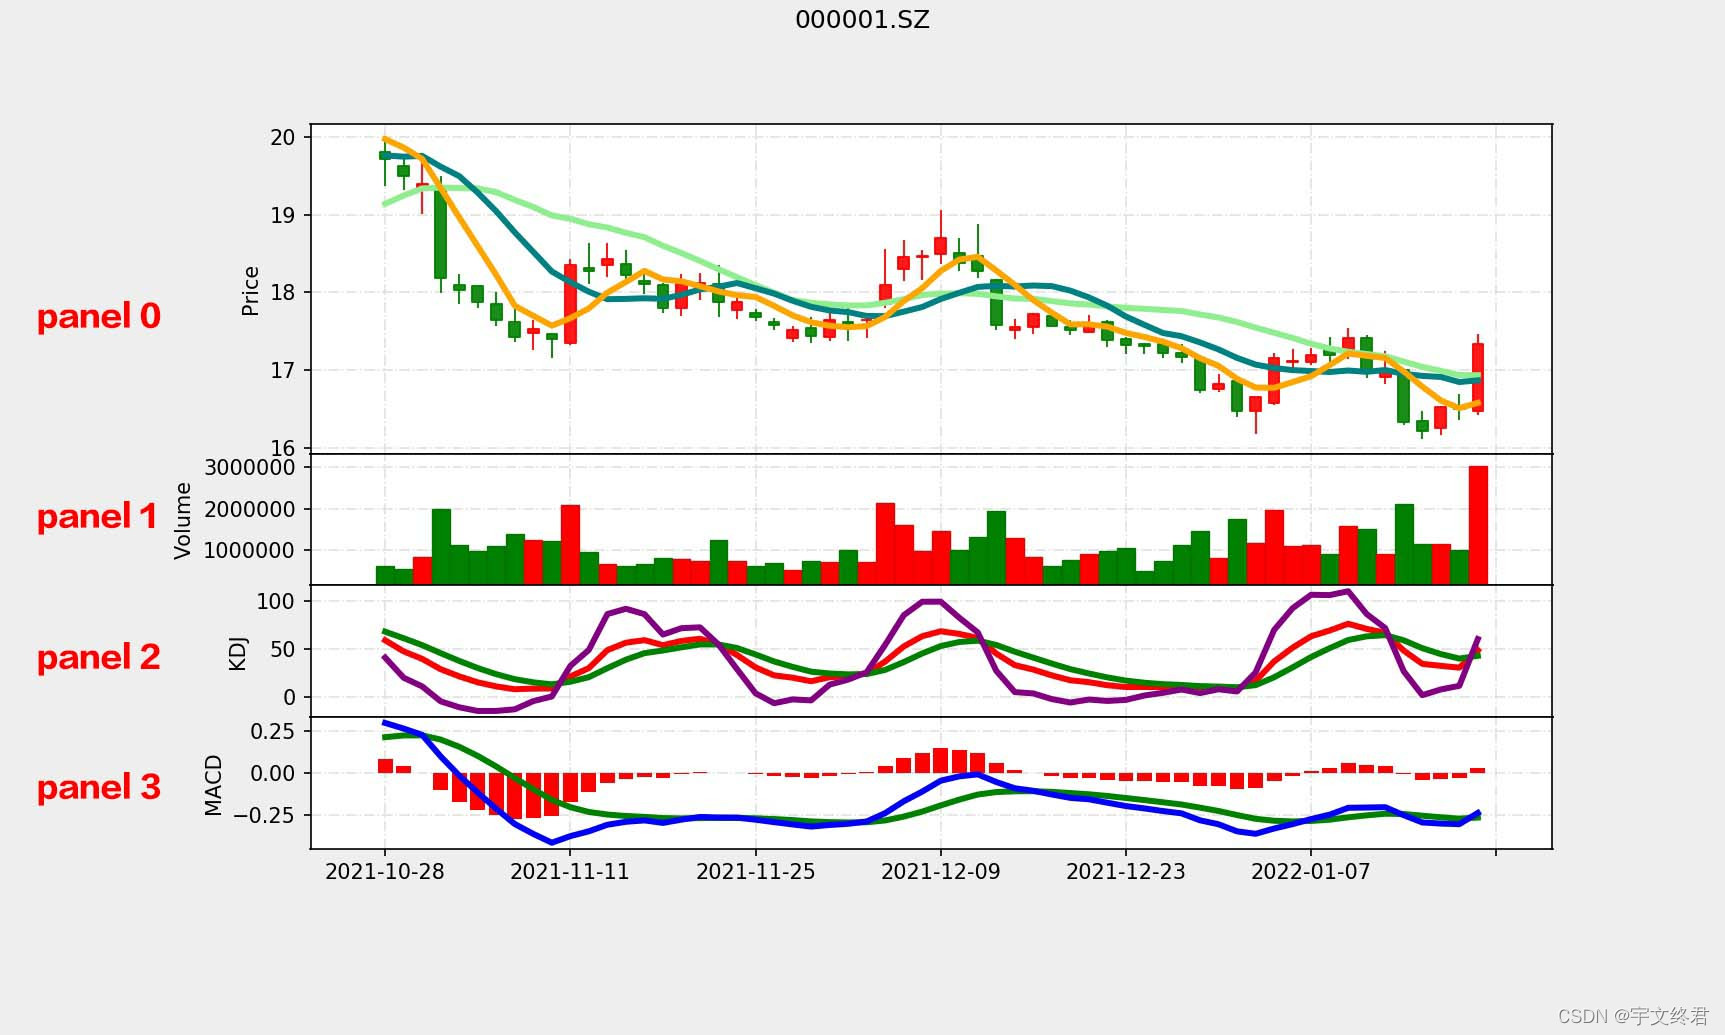
接上一章,在处理完技术指标结果后,为了让分析者有更直观的理解,我们要把被分析的股票最近60的K线图表示出来,并带上均线图、成交量、MACD、KDJ。
所用包
mplfinance
import mplfinance as mpf把从函数get_technical(stock_df)获得的相关技术指标macd_df,kdj_df,ma5_df,ma10_df,ma20_df用add_plot初始化。代码如下
add_plot = [
    mpf.make_addplot(ma20_df['SMA_20'].tail(60),panel=0,color='lightgreen'),
    mpf.make_addplot(ma10_df['SMA_10'].tail(60),panel=0,color='teal'),
    mpf.make_addplot(ma5_df['SMA_5'].tail(60),panel=0,color='orange'),
    mpf.make_addplot(kdj_df['K_9_3'].tail(60),panel=2,ylabel='KDJ',color='red'),
    mpf.make_addplot(kdj_df['D_9_3'].tail(60),panel=2,color='green'),
    mpf.make_addplot(kdj_df['J_9_3'].tail(60),panel=2,color='purple',secondary_y=False),
    mpf.make_addplot(macd_df['MACDh_12_26_9'].tail(60),type='bar',panel=3,color='red',secondary_y=False),
    mpf.make_addplot(macd_df['MACDs_12_26_9'].tail(60),panel=3,color='green',secondary_y=False),
    mpf.make_
我们要调取各个技术指标最近60天的数据,所以用tail(60),各个技术指标分配到不同的区间 以panel 0 、1、2、3分配位置。其中0是K线图、1是成交量图、2是KDJ、3是MACD。分别配置需要显示的颜色与形状

初始化图表样式,语法具体详细看这篇文章 Python+tushare+talib+mplfinance制作股票K线条和技术指标 https://blog.csdn.net/m0_64902855/article/details/122228591
my_color = mpf.make_marketcolors(
        up='red',
        down='green',
        edge='inherit',
        wick='inherit',
        volume='inherit'
    )


    my_style = mpf.make_mpf_style(
        marketcolors=my_color,
        figcolor='#EEEEEE',
        y_on_right=False,
        gridaxis='both',
        gridstyle='-.',
        gridcolor='#E1E1E1'
    )


    kwargs = dict(
        type='candle',
        volume=True,
        title='%s'%(stock_df.iloc[0,0]),
        ylabel='Price',
        ylabel_lower='Volume',
        figratio=(800,480),
        figscale=1.2,
        datetime_format='%Y-%m-%d',
        xrotation=0
    )
初始化保存图片的信息,用mpf.plot画出K线图
#保存股票K线图图片
save = dict(fname='%s.jpg'%stock_df.iloc[0,0],dpi=150,pad_inches=0.25)
mpf.plot(stock_df.tail(60),**kwargs,addplot=add_plot,style=my_style,savefig=save)
效果如下

最后将代码封装在draw_pic( )函数里,实现draw_pic(macd_df,kdj_df,ma5_df,ma10_df,ma20_df,stock_df)
完整代码
import mplfinance as mpf
import tushare as ts
import pandas as pd
import datetime
import pandas_ta as ta

token='你的token'
ts.set_token(token)
pro=ts.pro_api()

def get_stock(num):
    stocknum=num
    today = datetime.datetime.today()
    startday=today+datetime.timedelta(days=-365)
    today = today.strftime('%Y%m%d')
    startday =startday.strftime('%Y%m%d')

    stock_df= pro.daily(ts_code=stocknum, start_date=startday,end_date=today)

    stock_df['trade_date'] = pd.to_datetime(stock_df['trade_date'])
    stock_df.set_index('trade_date',inplace=True)
    stock_df=stock_df.rename(columns={'vol':'volume'})
    stock_df=stock_df.iloc[::-1]
    return stock_df

def get_technical(stock_df):
    #MACD
    macd_df = ta.macd(stock_df['close'])
    #KDJ
    kdj_df = ta.kdj(stock_df['high'],stock_df['low'],stock_df['close'])
    #均线 5、10、20天
    ma5_df = pd.DataFrame(ta.sma(stock_df['close'],length=5))
    ma10_df = pd.DataFrame(ta.sma(stock_df['close'],length=10))
    ma20_df = pd.DataFrame(ta.sma(stock_df['close'],length=20))

    #连接所有技术指标结果与收盘价以列形式在一个DataFrame
    total_df = pd.concat([macd_df,kdj_df,ma5_df,ma10_df,ma20_df,stock_df['close']],axis=1)
    #获取前12天的数据
    total_df=total_df.iloc[-12:,:]
    return macd_df,kdj_df,ma5_df,ma10_df,ma20_df,total_df

def get_analyse(total_df):
    result_df = pd.DataFrame(columns=['日期','MACD','KDJ','均线','收盘价'])

    for i in range(2,len(total_df)):
        date= total_df.index[i].strftime('%Y-%m-%d')
        result_df.loc[i,'日期'] = date
        result_df.loc[i,'收盘价'] = total_df.iloc[i,9]
        #MACD形态分析
        if total_df.iloc[i-1,0]<total_df.iloc[i-1,2] and total_df.iloc[i,0]>total_df.iloc[i,2] and total_df.iloc[i-1,1]<0 and total_df.iloc[i,1]>0:
            result_df.loc[i,'MACD']='低位金叉'
        elif total_df.iloc[i-1,0]<total_df.iloc[i-1,2] and total_df.iloc[i,0]>total_df.iloc[i,2]:
            result_df.loc[i,'MACD']='金叉'
        elif total_df.iloc[i-1,0]>0 and total_df.iloc[i-1,2]>0 and total_df.iloc[i,0]>0 and total_df.iloc[i,2]>0 and total_df.iloc[i-1,0]>total_df.iloc[i-1,2] and total_df.iloc[i,0]<total_df.iloc[i,2] and total_df.iloc[i-1,1]>0 and total_df.iloc[i,1]<0:
            result_df.loc[i,'MACD']='高位死叉'
        elif total_df.iloc[i-1,0]>total_df.iloc[i-1,2] and total_df.iloc[i,0]<total_df.iloc[i,2]:
            result_df.loc[i,'MACD']='死叉'
        elif total_df.iloc[i-1,0]<0 and total_df.iloc[i,0]>0:
            result_df.loc[i,'MACD']='DIF上穿0轴'
        else:
            result_df.loc[i,'MACD']='中性'

        #KDJ形态分析
        if total_df.iloc[i-1,3]<total_df.iloc[i-1,4] and total_df.iloc[i,3]>total_df.iloc[i,4] and total_df.iloc[i,3]<20 and total_df.iloc[i,4]<20 and total_df.iloc[i,5]<20:
            result_df.loc[i,'KDJ']='低位金叉'
        elif total_df.iloc[i-1,3]<total_df.iloc[i-1,4] and total_df.iloc[i,3]>total_df.iloc[i,4]:
            result_df.loc[i,'KDJ']='金叉'
        elif total_df.iloc[i-1,3]>total_df.iloc[i-1,4] and total_df.iloc[i,3]<total_df.iloc[i,4] and total_df.iloc[i,3]>50 and total_df.iloc[i,4]>50 and total_df.iloc[i,5]>50:
            result_df.loc[i,'KDJ']='高位死叉'
        elif total_df.iloc[i-1,3]>total_df.iloc[i-1,4] and total_df.iloc[i,3]<total_df.iloc[i,4]:
            result_df.loc[i,'KDJ']='死叉'
        elif total_df.iloc[i-1,5]<0 and total_df.iloc[i,5]>0:
            result_df.loc[i,'KDJ']='J线上穿0轴'
        elif total_df.iloc[i-1,5]>90 and total_df.iloc[i,5]>90 and total_df.iloc[i-1,5]>total_df.iloc[i,5]:
            result_df.loc[i,'KDJ']='适当减仓'
        elif total_df.iloc[i-1,5]<20 and total_df.iloc[i,5]<20 and total_df.iloc[i-1,5]<total_df.iloc[i,5]:
            result_df.loc[i,'KDJ']='适当关注'
        else:
            result_df.loc[i,'KDJ']='中性'


        #定义判断均线多种形态函数
        if total_df.iloc[i-1,6]<total_df.iloc[i-1,7] and total_df.iloc[i,6]>total_df.iloc[i,7]:
            result_df.loc[i,'均线']='5交10金叉'
        elif total_df.iloc[i-1,6]<total_df.iloc[i-1,8] and total_df.iloc[i,6]>total_df.iloc[i,8]:
            result_df.loc[i,'均线']='5交20金叉'
        elif total_df.iloc[i-1,6]>total_df.iloc[i-1,7] and total_df.iloc[i,6]<total_df.iloc[i,7]:
            result_df.loc[i,'均线']='5交10死叉'
        elif total_df.iloc[i-1,6]>total_df.iloc[i-1,8] and total_df.iloc[i,6]<total_df.iloc[i,8]:
            result_df.loc[i,'均线']='5交20死叉'
        elif total_df.iloc[i-2,6]<total_df.iloc[i-1,6] and total_df.iloc[i-1,6]>total_df.iloc[i,6]:
            result_df.loc[i,'均线']='5天线向下拐'
        elif total_df.iloc[i-2,6]>total_df.iloc[i-1,6] and total_df.iloc[i-1,6]<total_df.iloc[i,6]:
            result_df.loc[i,'均线']='5天线向上拐'
        elif total_df.iloc[i,9]>total_df.iloc[i,6]:
            result_df.loc[i,'均线']='5天线上'
        elif total_df.iloc[i,9]<total_df.iloc[i,6]:
            result_df.loc[i,'均线']='5天线下'
    return result_df

def draw_pic(macd_df,kdj_df,ma5_df,ma10_df,ma20_df,stock_df):
    add_plot = [
        mpf.make_addplot(ma20_df['SMA_20'].tail(60),panel=0,color='lightgreen'),
        mpf.make_addplot(ma10_df['SMA_10'].tail(60),panel=0,color='teal'),
        mpf.make_addplot(ma5_df['SMA_5'].tail(60),panel=0,color='orange'),
        mpf.make_addplot(kdj_df['K_9_3'].tail(60),panel=2,ylabel='KDJ',color='red'),
        mpf.make_addplot(kdj_df['D_9_3'].tail(60),panel=2,color='green'),
        mpf.make_addplot(kdj_df['J_9_3'].tail(60),panel=2,color='purple',secondary_y=False),
        mpf.make_addplot(macd_df['MACDh_12_26_9'].tail(60),type='bar',panel=3,color='red',secondary_y=False),
        mpf.make_addplot(macd_df['MACDs_12_26_9'].tail(60),panel=3,color='green',secondary_y=False),
        mpf.make_addplot(macd_df['MACD_12_26_9'].tail(60),panel=3,ylabel='MACD',color='blue'),
    ]


    my_color = mpf.make_marketcolors(
        up='red',
        down='green',
        edge='inherit',
        wick='inherit',
        volume='inherit'
    )


    my_style = mpf.make_mpf_style(
        marketcolors=my_color,
        figcolor='#EEEEEE',
        y_on_right=False,
        gridaxis='both',
        gridstyle='-.',
        gridcolor='#E1E1E1'
    )


    kwargs = dict(
        type='candle',
        volume=True,
        title='%s'%(stock_df.iloc[0,0]),
        ylabel='Price',
        ylabel_lower='Volume',
        figratio=(800,480),
        figscale=1.2,
        datetime_format='%Y-%m-%d',
        xrotation=0
    )


    save = dict(fname='%s.jpg'%stock_df.iloc[0,0],dpi=150,pad_inches=0.25)
    mpf.plot(stock_df.tail(60),**kwargs,addplot=add_plot,style=my_style,savefig=save)

    return\


get_stocknum =pd.read_excel('股票代码.xlsx')
stock_df = get_stock(get_stocknum.iloc[0,0])
macd_df,kdj_df,ma5_df,ma10_df,ma20_df,total_df=get_technical(stock_df)
result_df=get_analyse(total_df)
draw_pic(macd_df,kdj_df,ma5_df,ma10_df,ma20_df,stock_df)


 被折叠的 条评论
为什么被折叠?


