1、安装echarts依赖包
npm install echarts --save
npm install echarts vue-echarts
2、全局引入echarts
import { createApp } from 'vue'
import App from './App.vue'

import ECharts from 'vue-echarts' // 引入ECharts
import 'echarts' // 全局引入echarts

const app = createApp(App)

app.component('ECharts',ECharts)
app.mount('#app')
3、在界面直接就可以使用
    <template>
     <div>
      <e-charts class="chart" :option="option" />
     </div>
   </template>

<script setup>
import { ref, computed } from 'vue'

const option = computed(() => {
  return {
    title: {
      text: 'Stacked Line'
    },
    tooltip: {
      trigger: 'axis'
    },
    legend: {
      data: ['Email', 'Union Ads', 'Video Ads', 'Direct', 'Search Engine']
    },
    grid: {
      left: '3%',
      right: '4%',
      bottom: '3%',
      containLabel: true
    },
    toolbox: {
      feature: {
        saveAsImage: {}
      }
    },
    xAxis: {
      type: 'category',
      boundaryGap: false,
      data: ['Mon', 'Tue', 'Wed', 'Thu', 'Fri', 'Sat', 'Sun']
    },
    yAxis: {
      type: 'value'
    },
    series: [
      {
        name: 'Email',
        type: 'line',
        stack: 'Total',
        data: [120, 132, 101, 134, 90, 230, 210]
      },
      {
        name: 'Union Ads',
        type: 'line',
        stack: 'Total',
        data: [220, 182, 191, 234, 290, 330, 310]
      },
      {
        name: 'Video Ads',
        type: 'line',
        stack: 'Total',
        data: [150, 232, 201, 154, 190, 330, 410]
      },
      {
        name: 'Direct',
        type: 'line',
        stack: 'Total',
        data: [320, 332, 301, 334, 390, 330, 320]
      },
      {
        name: 'Search Engine',
        type: 'line',
        stack: 'Total',
        data: [820, 932, 901, 934, 1290, 1330, 1320]
      }
    ]
  }
})


</script>
<style lang="scss" scoped>

.chart {
  height: 400px;
}
</style>
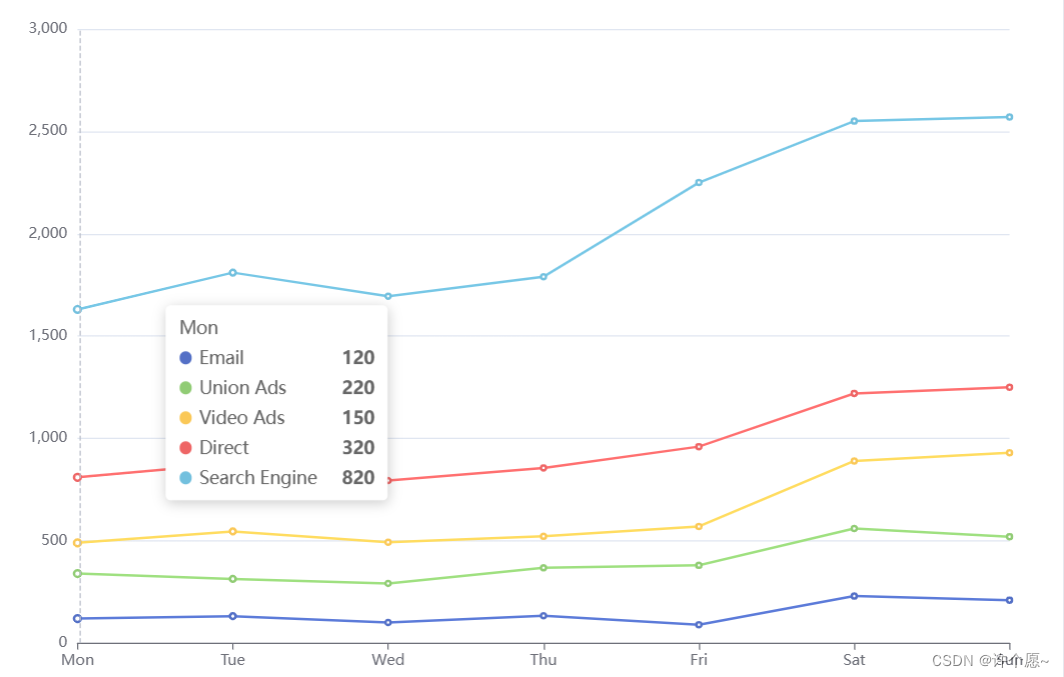
4、效果图


 174
174

 被折叠的 条评论
为什么被折叠?
被折叠的 条评论
为什么被折叠?
 到【灌水乐园】发言


