


2023/2/16
主要学习了以下内容:
- python的文件读写操作
- matplotlib:直方图的绘制
- numpy数组的创建和计算
python的文件读写操作
创建文本对象open()
open()函数用于创建文件对象,相当于创建 了文件的索引,通过这个索引可以对文件进行各种操作。
基本的文件写入操作
文本文件的写入一般就是三个步骤:
- 创建文件对象
- 写入数据
- 关闭文件对象
f = open(r'a.txt','a')
s = 'text'
f.write(s)
f.close()
操作完文件需要将文件关闭,以减少系统资源的占用
常用编码介绍
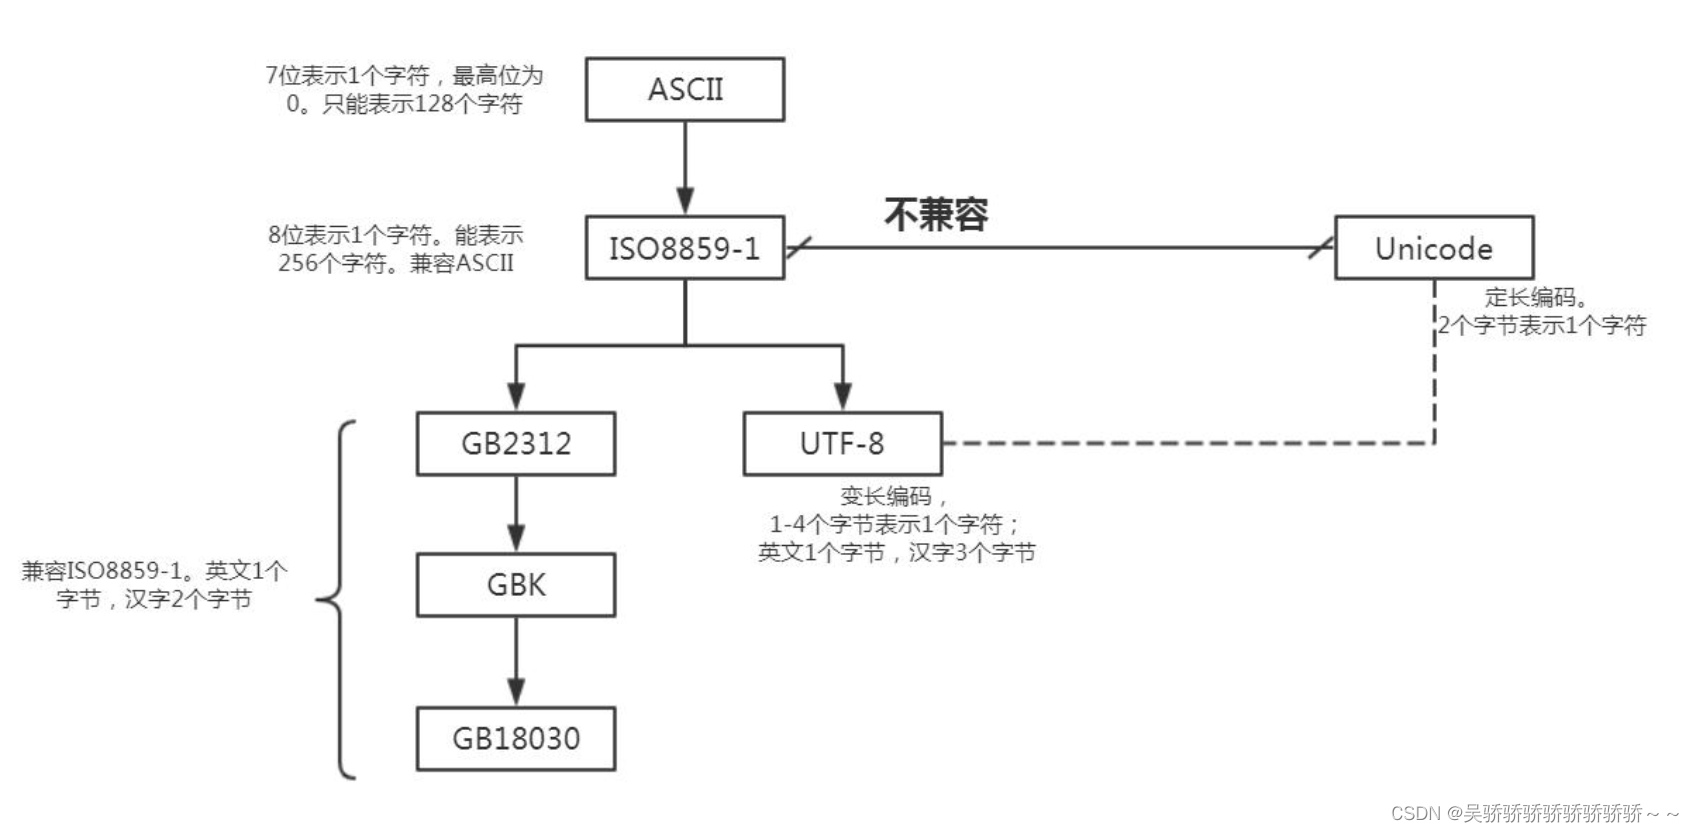
图中从上往下是兼容的,其中GBK是微软默认的,和UTF-8不兼容。
pycharm编译器中使用unicode编码的,但是存储代码时会转换成utf-8。
matplotlib直方图的绘制
#!usr/bin/env python
# -*- coding:utf-8 -*-
"""
@author: 13928
@file: zhifangtu02.py
@time: 2023/02/16
@desc:
"""
from matplotlib import pyplot as plt

font = {'family' : 'SimHei',
        'weight' : 'bold',
        'size'   : '20'}
plt.rc('font', **font)               # 步骤一(设置字体的更多属性)
plt.rc('axes', unicode_minus=False)  # 步骤二(解决坐标轴负数的负号显示问题)

interval = [0,5,10,15,20,25,30,35,40,45,60,90,150]
width = [5,5,5,5,5,5,5,5,5,15,30,60]
quantity = [836,2737,3723,3926,3596,1438,3273,642,824,613,215,47]

plt.figure(figsize=(20,8),dpi=80)
plt.bar(range(len(quantity)),quantity,width=1)

_x = [i-0.5 for i in range(len(quantity)+1)]
_x_label = interval
plt.xticks(_x,_x_label)

plt.grid()
plt.show()
#!usr/bin/env python
# -*- coding:utf-8 -*-
"""
@author: 13928
@file: zhifangtu01.py
@time: 2023/02/13
@desc:
"""
from matplotlib import pyplot as plt

font = {'family' : 'SimHei',
        'weight' : 'bold',
        'size'   : '20'}
plt.rc('font', **font)               # 步骤一(设置字体的更多属性)
plt.rc('axes', unicode_minus=False)  # 步骤二(解决坐标轴负数的负号显示问题)

plt.figure(figsize=(20,12))
a=[131,  98, 125, 131, 124, 139, 131, 117, 128, 108, 135, 138, 131, 102, 107, 114, 119, 128, 121, 142, 127, 130, 124, 101, 110, 116, 117, 110, 128, 128, 115,  99, 136, 126, 134,  95, 138, 117, 111,78, 132, 124, 113, 150, 110, 117,  86,  95, 144, 105, 126, 130,126, 130, 126, 116, 123, 106, 112, 138, 123,  86, 101,  99, 136,123, 117, 119, 105, 137, 123, 128, 125, 104, 109, 134, 125, 127,105, 120, 107, 129, 116, 108, 132, 103, 136, 118, 102, 120, 114,105, 115, 132, 145, 119, 121, 112, 139, 125, 138, 109, 132, 134,156, 106, 117, 127, 144, 139, 139, 119, 140,  83, 110, 102,123,107, 143, 115, 136, 118, 139, 123, 112, 118, 125, 109, 119, 133,112, 114, 122, 109, 106, 123, 116, 131, 127, 115, 118, 112, 135,115, 146, 137, 116, 103, 144,  83, 123, 111, 110, 111, 100, 154,136, 100, 118, 119, 133, 134, 106, 129, 126, 110, 111, 109, 141,120, 117, 106, 149, 122, 122, 110, 118, 127, 121, 114, 125, 126,114, 140, 103, 130, 141, 117, 106, 114, 121, 114, 133, 137,  92,121, 112, 146,  97, 137, 105,  98, 117, 112,  81,  97, 139, 113,134, 106, 144, 110, 137, 137, 111, 104, 117, 100, 111, 101, 110,105, 129, 137, 112, 120, 113, 133, 112,  83,  94, 146, 133, 101,131, 116, 111,  84, 137, 115, 122, 106, 144, 109, 123, 116, 111,111, 133, 150]

d = 3
num_bins = (max(a)-min(a))//d

plt.hist(a,num_bins,density=True)

plt.xticks(range(min(a),max(a)+d,d))
plt.grid()
plt.show()
直方图使用plt.hist()方法,该方法只适用于未处理过的原始数据。如上面的a
numpy数组的创建和计算
创建数组
a = np.array([1,2,3,4])
b = np.array(range(1,6))
c = np.arange(1,6)  #注意arange和range的区别
形状
# reshape有返回值 不会对原来数据改变(原地操作)
# reshape里有几个数 就是几维数据

t1 = np.arange(24)
print(t1)
print(t1.reshape((2,3,4)))
print(t1.reshape((4,6)))
# reshape里有几个数 就是几维数据
t2 = np.array([[1,2,3],[4,5,6],[7,8,9],[10,11,12]])
t3 = t2.reshape((12,1))
# t3 = t2.reshape((12,))  # 这两行代码不相同 一个是二维 一个是一维
print(t3)
t4 = t2.flatten()
print(t4)
print(t2+2)


 被折叠的 条评论
为什么被折叠?
被折叠的 条评论
为什么被折叠?
 到【灌水乐园】发言


