


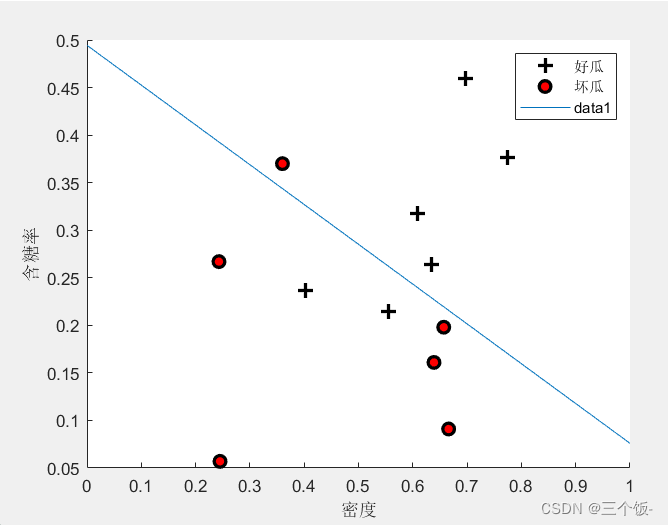
西瓜书P69习题3.3
%求beta=(w;b);w=(w1 w2)
%对数几率回归

training_set=[0.697 0.460 1;
    0.774 0.376 1;
    0.634 0.264 1;
    0.608 0.318 1;
    0.556 0.215 1;
    0.403 0.237 1;
    0.657 0.198 0;
    0.360 0.370 0;
    0.666 0.091 0;
    0.243 0.267 0;
    0.245 0.057 0;
    0.639 0.161 0];%训练集数据 1:好瓜,0:坏瓜
x=training_set(:,[1,2]);y=training_set(:,3);
m=size(x,1);%训练集样本点个数
plotdata(x,y);%定义函数
hold on
xlabel('密度'),ylabel('含糖率'),legend('好瓜','坏瓜')
x_=[x';zeros(1,m)+1];

b0=[0;0;1];%x初始点
L_old=0;
%求优化函数
while(1)
    L_cur=0;
    for i=1:m
        L_cur=L_cur+(-y(i)*b0.'*x_(:,i))+log(1+exp(b0.'*x_(:,i)));
    end

    if(L_cur-L_old)<0.0001
        break;
    end

    n=n+1;
    L_old=L_cur;
    d1=0;d2=0;

    for i=1:m
     p1(i)=1-1/(1+exp(b0.'*x_(:,i)));
     d1=d1-x_(:,i)*(y(i)-p1(i));
     d2=d2+x_(:,i)*x_(:,i).'*p1(i)*(1-p1(i));
    end
    b1=b0-d2\d1;%d2的逆乘以d1
    b0=b1;
end
b1
%画出分离超平面
x1=0:0.01:1;
y1=(-b1(3)-b1(1)*x1)/b1(2);
plot(x1,y1)


%  画训练数据的点
function plotdata(x,y)
figure;hold on;
pos=find(y==1);%找y=1的正实例点
neg=find(y==0);%找y=0的负实例点
plot(x(pos,1),x(pos,2),'k+','linewidth',2,'markersize',9);
plot(x(neg,1),x(neg,2),'ko','markerfacecolor','r','linewidth',2,'markersize',7);
%画出两类点
hold off;
end
运行结果


 1690
1690


 被折叠的 条评论
为什么被折叠?
被折叠的 条评论
为什么被折叠?
 到【灌水乐园】发言


