


实验作业3-1
1.1 从文件gencode.v46.chr_patch_hapl_scaff.annotation.gff3.gz中提取type为gene的记录。
# 导入所需的库
import os
import pandas as pd

# 设置工作目录
os.chdir('D:/桌面/实验/python实验/python-class/')

# 读取压缩包数据
df = pd.read_csv('./gencode.v46.chr_patch_hapl_scaff.annotation.gff3.gz',
                 compression = 'gzip', sep = '\t', comment = '#', header = None, low_memory = False)

# 检查数据
df.head()
##       0       1  ...  7                                                  8
## 0  chr1  HAVANA  ...  .  ID=ENSG00000290825.1;gene_id=ENSG00000290825.1...
## 1  chr1  HAVANA  ...  .  ID=ENST00000456328.2;Parent=ENSG00000290825.1;...
## 2  chr1  HAVANA  ...  .  ID=exon:ENST00000456328.2:1;Parent=ENST0000045...
## 3  chr1  HAVANA  ...  .  ID=exon:ENST00000456328.2:2;Parent=ENST0000045...
## 4  chr1  HAVANA  ...  .  ID=exon:ENST00000456328.2:3;Parent=ENST0000045...
##
## [5 rows x 9 columns]
pd.set_option('display.max_columns', None)
df.head()
##       0       1           2      3      4  5  6  7  \
## 0  chr1  HAVANA        gene  11869  14409  .  +  .
## 1  chr1  HAVANA  transcript  11869  14409  .  +  .
## 2  chr1  HAVANA        exon  11869  12227  .  +  .
## 3  chr1  HAVANA        exon  12613  12721  .  +  .
## 4  chr1  HAVANA        exon  13221  14409  .  +  .
##
##                                                    8
## 0  ID=ENSG00000290825.1;gene_id=ENSG00000290825.1...
## 1  ID=ENST00000456328.2;Parent=ENSG00000290825.1;...
## 2  ID=exon:ENST00000456328.2:1;Parent=ENST0000045...
## 3  ID=exon:ENST00000456328.2:2;Parent=ENST0000045...
## 4  ID=exon:ENST00000456328.2:3;Parent=ENST0000045...
df[2]
## 0                gene
## 1          transcript
## 2                exon
## 3                exon
## 4                exon
##               ...
## 3766027    transcript
## 3766028          exon
## 3766029          gene
## 3766030    transcript
## 3766031          exon
## Name: 2, Length: 3766032, dtype: object
# 赋予新的列名
col_names = ['chrid', 'source', 'type', 'start', 'end', 'score', 'strand', 'phase', 'attributes']
df.columns = col_names
df.head()
##   chrid  source        type  start    end score strand phase  \
## 0  chr1  HAVANA        gene  11869  14409     .      +     .
## 1  chr1  HAVANA  transcript  11869  14409     .      +     .
## 2  chr1  HAVANA        exon  11869  12227     .      +     .
## 3  chr1  HAVANA        exon  12613  12721     .      +     .
## 4  chr1  HAVANA        exon  13221  14409     .      +     .
##
##                                           attributes
## 0  ID=ENSG00000290825.1;gene_id=ENSG00000290825.1...
## 1  ID=ENST00000456328.2;Parent=ENSG00000290825.1;...
## 2  ID=exon:ENST00000456328.2:1;Parent=ENST0000045...
## 3  ID=exon:ENST00000456328.2:2;Parent=ENST0000045...
## 4  ID=exon:ENST00000456328.2:3;Parent=ENST0000045...
# 提取type为gene的数据
df['type'].value_counts()
## type
## exon                                      1808998
## CDS                                        980651
## transcript                                 278220
## three_prime_UTR                            226422
## five_prime_UTR                             190230
## start_codon                                109068
## stop_codon                                 101701
## gene                                        70611
## stop_codon_redefined_as_selenocysteine        131
## Name: count, dtype: int64
df_gene = df[df['type'] == 'gene']
df_gene.head()
##    chrid   source  type  start    end score strand phase  \
## 0   chr1   HAVANA  gene  11869  14409     .      +     .
## 5   chr1   HAVANA  gene  12010  13670     .      +     .
## 13  chr1   HAVANA  gene  14696  24886     .      -     .
## 25  chr1  ENSEMBL  gene  17369  17436     .      -     .
## 28  chr1   HAVANA  gene  29554  31109     .      +     .
##
##                                            attributes
## 0   ID=ENSG00000290825.1;gene_id=ENSG00000290825.1...
## 5   ID=ENSG00000223972.6;gene_id=ENSG00000223972.6...
## 13  ID=ENSG00000227232.6;gene_id=ENSG00000227232.6...
## 25  ID=ENSG00000278267.1;gene_id=ENSG00000278267.1...
## 28  ID=ENSG00000243485.5;gene_id=ENSG00000243485.5...
1.2 将chrid、start、end、gene_id、gene_type、gene_name(不包括“gene_id=”、“gene_type=”或“gene_name=”部分)和利用start和end计算得到的各基因长度length,整理为一个名为gdf的DataFrame(字段作为列名)。
# 合并
gdf = pd.concat([df_gene, df_gene['attributes'].str.split(';',expand=True)], axis = 1)

# 单独删去attributes列
del gdf['attributes']
# 批量删去source、type、strand、phase列
gdf.drop(columns = ['source', 'type', 'score', 'strand', 'phase', 0, 4, 5, 6, 7], inplace = True)
gdf.head()
##    chrid  start    end                          1  \
## 0   chr1  11869  14409  gene_id=ENSG00000290825.1
## 5   chr1  12010  13670  gene_id=ENSG00000223972.6
## 13  chr1  14696  24886  gene_id=ENSG00000227232.6
## 25  chr1  17369  17436  gene_id=ENSG00000278267.1
## 28  chr1  29554  31109  gene_id=ENSG00000243485.5
##
##                                                2                      3
## 0                               gene_type=lncRNA      gene_name=DDX11L2
## 5   gene_type=transcribed_unprocessed_pseudogene      gene_name=DDX11L1
## 13              gene_type=unprocessed_pseudogene       gene_name=WASH7P
## 25                               gene_type=miRNA    gene_name=MIR6859-1
## 28                              gene_type=lncRNA  gene_name=MIR1302-2HG
# 重新赋予新的列名
gdf.columns = ['chrid', 'start', 'end', 'gene_id', 'gene_type', 'gene_name']

# 用等号拆分并保留右半部分
gdf['gene_id'] = [item.split('=')[1] for item in gdf['gene_id']]
gdf['gene_type'] = [item.split('=')[1] for item in gdf['gene_type']]
gdf['gene_name'] = [item.split('=')[1] for item in gdf['gene_name']]
gdf.head()
##    chrid  start    end            gene_id                           gene_type  \
## 0   chr1  11869  14409  ENSG00000290825.1                              lncRNA
## 5   chr1  12010  13670  ENSG00000223972.6  transcribed_unprocessed_pseudogene
## 13  chr1  14696  24886  ENSG00000227232.6              unprocessed_pseudogene
## 25  chr1  17369  17436  ENSG00000278267.1                               miRNA
## 28  chr1  29554  31109  ENSG00000243485.5                              lncRNA
##
##       gene_name
## 0       DDX11L2
## 5       DDX11L1
## 13       WASH7P
## 25    MIR6859-1
## 28  MIR1302-2HG
# 用end-start得到length,并作为新列
gdf['length'] = gdf['end'] - gdf['start']
gdf['length']
## 0           2540
## 5           1660
## 13         10190
## 25            67
## 28          1555
##            ...
## 3765934     2403
## 3765941     5898
## 3765957    23770
## 3766026      105
## 3766029      175
## Name: length, Length: 70611, dtype: int64
gdf['length'].describe()
## count    7.061100e+04
## mean     3.033053e+04
## std      8.773598e+04
## min      7.000000e+00
## 25%      5.900000e+02
## 50%      3.518000e+03
## 75%      2.232700e+04
## max      2.473538e+06
## Name: length, dtype: float64
gdf.head()
##    chrid  start    end            gene_id                           gene_type  \
## 0   chr1  11869  14409  ENSG00000290825.1                              lncRNA
## 5   chr1  12010  13670  ENSG00000223972.6  transcribed_unprocessed_pseudogene
## 13  chr1  14696  24886  ENSG00000227232.6              unprocessed_pseudogene
## 25  chr1  17369  17436  ENSG00000278267.1                               miRNA
## 28  chr1  29554  31109  ENSG00000243485.5                              lncRNA
##
##       gene_name  length
## 0       DDX11L2    2540
## 5       DDX11L1    1660
## 13       WASH7P   10190
## 25    MIR6859-1      67
## 28  MIR1302-2HG    1555
1.3 将gdf以Tab分隔的形式存储到文件gene.txt中(文件中不保留行标签)。
# 保存文件
gdf.to_csv('gdf.txt', index=False, encoding='utf-8')
实验作业3-2
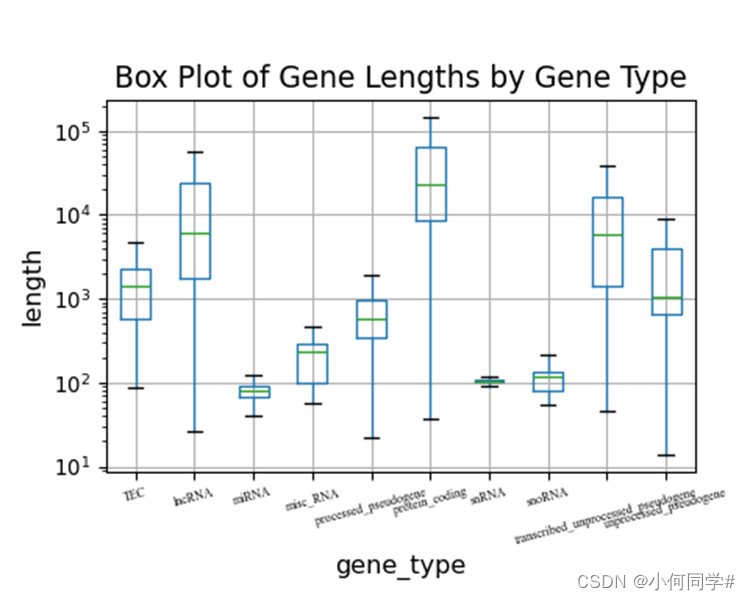
2.1 对不同gene_type,统计各类型length的分布,绘制箱型图,以300pi保存为pdf文件。
import matplotlib.pyplot as plt

# type过多选前十种
top_type = gdf['gene_type'].value_counts()[:10].index.tolist()
box_data = gdf[gdf['gene_type'].isin(top_type)][['gene_type', 'length']]

# 绘制箱线图
box_data.boxplot(column='length', by='gene_type', showfliers=False, widths=0.5)
# 将y轴的比例设置为对数尺度,以更好地表示数据的分布
plt.yscale('log')
# 设置x轴标签
plt.xlabel('gene_type', fontsize=12)
# 设置y轴标签
plt.ylabel('length', fontsize=12)
# 设置x轴刻度标签的旋转角度为15度,并且设置字体和字号
plt.xticks(rotation=15, fontproperties='Times New Roman', size=6)
## (array([ 1,  2,  3,  4,  5,  6,  7,  8,  9, 10]), [Text(1, 0, 'TEC'), Text(2, 0, 'lncRNA'), Text(3, 0, 'miRNA'), Text(4, 0, 'misc_RNA'), Text(5, 0, 'processed_pseudogene'), Text(6, 0, 'protein_coding'), Text(7, 0, 'snRNA'), Text(8, 0, 'snoRNA'), Text(9, 0, 'transcribed_unprocessed_pseudogene'), Text(10, 0, 'unprocessed_pseudogene')])
# 根据图形元素自动调整子图参数,以防止x轴标签或标题遮挡
plt.tight_layout()
# 删除pandas自动生成的标题
plt.suptitle('')
# 设置标题
plt.title('Box Plot of Gene Lengths by Gene Type', fontsize=14)
# 以300pi保存为pdf文件
plt.savefig('Box Plot of Gene Lengths by Gene Type.pdf', dpi=300)
# 箱线图展示
plt.show()
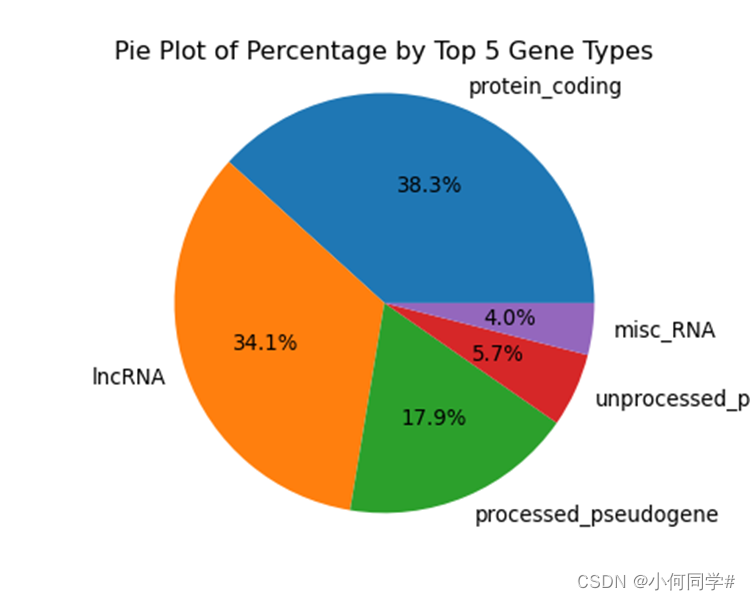
2.2 对不同gene_type,统计数目最多的5种,绘制饼图,以300pi保存为pdf文件。
import matplotlib.pyplot as plt

# 统计数目最多的5种gene_type及其数目
pie_data = pd.DataFrame({
    'gene_type':gdf['gene_type'].value_counts()[:5].index.tolist(),
    'counts':gdf['gene_type'].value_counts()[:5].tolist()
})

# 提取 'gene_type' 和 'counts' 作为饼图的标签和数据
labels = pie_data['gene_type']
sizes = pie_data['counts']

# 绘制饼图
plt.pie(sizes, labels=labels, autopct='%1.1f%%')
## ([<matplotlib.patches.Wedge object at 0x0000017152A96B90>, <matplotlib.patches.Wedge object at 0x000001714E282710>, <matplotlib.patches.Wedge object at 0x000001714E29ED10>, <matplotlib.patches.Wedge object at 0x000001714E283ED0>, <matplotlib.patches.Wedge object at 0x0000017152A1C550>], [Text(0.39635091237930165, 1.026112057358306, 'protein_coding'), Text(-1.0389360288264298, -0.36140272274343493, 'lncRNA'), Text(0.4278052340150467, -1.0134015402343393, 'processed_pseudogene'), Text(1.0002724817856155, -0.45766249811672977, 'unprocessed_pseudogene'), Text(1.091392537231306, -0.13734019686825963, 'misc_RNA')], [Text(0.21619140675234635, 0.5596974858318032, '38.3%'), Text(-0.5666923793598707, -0.1971287578600554, '34.1%'), Text(0.2333483094627527, -0.5527644764914578, '17.9%'), Text(0.545603171883063, -0.24963408988185257, '5.7%'), Text(0.595305020307985, -0.07491283465541433, '4.0%')])
# 保证饼图为圆形
plt.axis('equal')
## (-1.0999974729173647, 1.0999998796627317, -1.0999974290383818, 1.099994675423214)
# 设置标题
plt.title('Pie Plot of Percentage by Top 5 Gene Types')
# 以300pi保存为pdf文件
plt.savefig('Pie Plot of Percentage by Top 5 Gene Types.pdf', dpi=300)
# 饼图展示
plt.show()


 3万+
3万+

 被折叠的 条评论
为什么被折叠?
被折叠的 条评论
为什么被折叠?
 到【灌水乐园】发言


