


<template>
  <div
    class="klji"
    style="
      background: rgba(4, 17, 37, 0.5);
      padding: 10px 0;
      position: relative;
    "
  >
    <span
      style="
        position: absolute;
        left: 10px;
        top: 40px;
        z-index: 100000;
        color: rgb(255, 255, 255);
        font-size: 12px;
      "
      >单位:个</span
    >
    <div
      id="myChart2_ss"
      :style="{ width: 'clac(100%)', height: '325px' }"
      style="margin-top: 0"
    ></div>
    <div class="yuan"></div>
  </div>
</template>

<script setup>
import * as echarts from "echarts";
import { ref, reactive, toRefs, onMounted } from "vue";
let list1 = ref([]);
let list2 = ref([]);
let list3 = ref([]);
const getData = (data) => {
  list1.value = data.ydata.find((item) => item.name == "已有数")?.num;
  list2.value = data.ydata.find((item) => item.name == "总数")?.num;
  list3.value = data.ydata.find((item) => item.name == "覆盖比例")?.num;
  // 需要获取到element,所以是onMounted的Hook
  let myChart = echarts.init(document.getElementById("myChart2_ss"));
  // 绘制图表
  myChart.setOption({
    tooltip: {
      trigger: "axis",
      axisPointer: {
        type: "cross",
        crossStyle: {
          color: "#999",
        },
      },
      className: "dfbdf11",
      backgroundColor: "transparent",
      formatter: function (params) {
        var htmlText = `<div class='custom-tooltip-style'>
        <div class="til">${params[0].axisValue}</div>
        <div class="cont">${params[0].seriesName}: <span>${params[0].value}个</span></div>
        <div class="cont">${params[1].seriesName}: <span>${params[1].value}个</span></div>
        <div class="cont">${params[2].seriesName}: <span>${params[2].value}%</span></div>
        </div>`;
        return htmlText;
      },
    },
    grid: {
      top: "20%",
      bottom: "4%",
      left: "4%",
      right: "4%",
      containLabel: true,
    },
    legend: {
      data: ["已有数", "总数", "覆盖比例"],
      textStyle: {
        color: "#fff",
      },
    },
    xAxis: [
      {
        type: "category",
        data: ["主类", "亚类", "基本类型"],
        axisPointer: {
          type: "shadow",
        },
        axisLabel: {
          textStyle: {
            // 设置标签文字样式
            color: "#FFFFFE", // 标签文字颜色
          },
        },
      },
    ],
    yAxis: [
      {
        type: "value",
        min: 0,
        max: 150,
        interval: 30,
        axisLabel: {
          formatter: "{value}",
          textStyle: {
            color: "#FFFFFE",
          },
        },
        splitLine: {
          //分割线配置
          lineStyle: {
            color: "#142a66",
          },
        },
      },
      {
        type: "value",
        min: 0,
        max: 100,
        interval: 20,
        axisLabel: {
          formatter: "{value}% ",
          textStyle: {
            color: "#FFFFFE",
          },
        },
        splitLine: {
          //分割线配置
          lineStyle: {
            color: "#142a66",
          },
        },
      },
    ],
    series: [
      {
        name: "已有数",
        type: "bar",
        barWidth: 20,
        tooltip: {
          valueFormatter: function (value) {
            return value + " 个";
          },
        },
        barGap: "40%",
        itemStyle: { color: "#3358b5" },
        data: list1.value,
      },
      {
        name: "总数",
        type: "bar",
        barWidth: 20,
        tooltip: {
          valueFormatter: function (value) {
            return value + " 个";
          },
        },
        barGap: "40%",
        itemStyle: { color: "#6bd0f4" },
        data: list2.value,
      },
      {
        name: "覆盖比例",
        type: "line",
        yAxisIndex: 1,
        tooltip: {
          valueFormatter: function (value) {
            return value + " %";
          },
        },
        symbol: "circle",
        symbolSize: 6,
        itemStyle: {
          normal: {
            color: "#ff1bf1",
          },
        },
        data: list3.value,
      },
    ],
  });
  let num = Math.floor(Math.random() * 3) + 0;
  if (num == 0 || num == 1) {
    num = 0;
  }
  setTimeout(function () {
    myChart.dispatchAction({
      type: "highlight",
      seriesIndex: [0, 1, 2, 3, 4, 5, 6, 7, 8],
      dataIndex: num,
    });
    myChart.dispatchAction({
      type: "showTip",
      seriesIndex: 0,
      dataIndex: num,
    });
  }, 1000);
};
// onMounted(() => {

// });
defineExpose({
  getData,
});
</script>
<style scoped lang="scss">
.klji {
  box-sizing: border-box !important;
}
:deep(.dfbdf11) {
  padding: 0 !important;
  border: none !important;
  background-color: transparent;
  // 给子盒子自定义样式
  .custom-tooltip-style {
    width: 240px;
    // height: 140px;
    background-image: url("../../../assets/images/static/two_bg.png");
    background-size: cover;
    background-repeat: no-repeat;
    color: #fff;
    font-style: italic;
    display: flex;
    flex-direction: column;
    font-weight: 700;
    padding: 20px;
    padding-bottom: 20px;
    position: relative;
    z-index: 10000000000000000000000;
    .til {
      height: 40px;
      line-height: 40px;
      margin: 0 20px;
      font-size: 18px;
      border-bottom: 1px solid #2cc1f2;
      background: linear-gradient(to bottom, #ffffff, #46aee4) !important;
      -webkit-background-clip: text !important;
      -webkit-text-fill-color: transparent !important;
    }
    .cont {
      margin-left: 20px;
      width: 100%;
      padding-top: 6px;
      span {
        background: linear-gradient(to bottom, #ffffff, #46aee4) !important;
        -webkit-background-clip: text !important;
        -webkit-text-fill-color: transparent !important;
      }
    }
  }
}
</style>
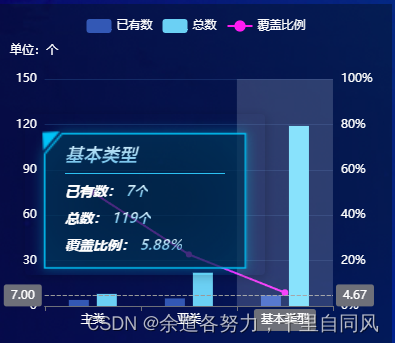
核心代码:
随机高亮选中(这里的3是,图表内柱子的个数)
let num = Math.floor(Math.random() * 3) + 0;
  if (num == 0 || num == 1) {
    num = 0;
  }
  setTimeout(function () {
    myChart.dispatchAction({
      type: "highlight",
      seriesIndex: [0, 1, 2, 3, 4, 5, 6, 7, 8],
      dataIndex: num,
    });
    myChart.dispatchAction({
      type: "showTip",
      seriesIndex: 0,
      dataIndex: num,
    });
  }, 1000);
效果:


 1112
1112

 被折叠的 条评论
为什么被折叠?
被折叠的 条评论
为什么被折叠?
 到【灌水乐园】发言


