


立体柱状图由三个条形图组成,分别承担的责任是:
1. 数据的展示
2 .标签
3. 柱状图之间的间隙
设置柱状图的方式有很多,还有一些是使用自定义的方式展示的,根据自己的需求使用吧。
效果:
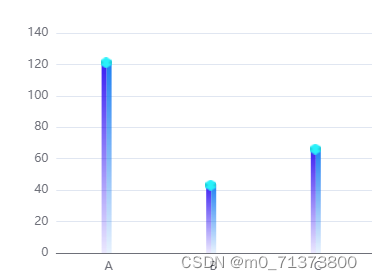
series 的代码:
// 组件
series:[

        // 左侧的渐变柱形
        // 这两个系列为一组,数据多的话需要两个一起循环
         {
            // ,接受传递的数据值
            name: this.seriesData[i][0],
            type: "bar",
            showSymbol: false, // 是否显示自定义的图形
            // hoverAnimation: false,
            data: this.seriesData[i].slice(1),
            barWidth: 5, //柱图宽度
            symbol: "diamond",
            global: false,
            // barCategoryGap:'60%',
            itemStyle: {
              // 左面
              // 设置柱形的渐变以及圆角
              normal: {
                color: {
                  type: "liner",
                  x: 0,
                  y: 0,
                  x2: 0,
                  y2: 1,
                  global: false,
                  colorStops: [
                    { offset: 0, color: this.seriesColor[i][0] },
                    { offset: 1, color: this.seriesColor[i][1] },
                  ],
                },
                barBorderRadius: [100, 0, 0, 0],
              },
            },
          },

          // 右侧的渐变柱形 以及 头部的定位盒子
          {
            name: this.seriesData[i][0],
            tooltip: {
              show: true,
            },
            type: "bar",
            barWidth: 5,

            label: {
              show: true,
              // 标签的定位
              position: [-6, 3],
              // 设置标签与柱条的距离
              distance: -5,
              formatter: ["{a|}"].join("\n"),
              // 富文本的设置.目的是为了让头部的盒子显示在合适的位置
              rich: {
                a: {
                  color: "red",
                  lineHeight: 0,
                  backgroundColor: {
                    image: this.seriesImage[i],
                  },
                  width: 11,
                  height: 11,
                },
              },
            },
            // 设置柱形的渐变以及圆角
            itemStyle: {
              normal: {
                color: {
                  type: "liner",
                  x: 0,
                  y: 0,
                  x2: 0,
                  y2: 1,
                  global: false,
                  colorStops: [
                    { offset: 0, color: this.seriesColor[i][2] },
                    { offset: 1, color: this.seriesColor[i][3] },
                  ],
                },
                barBorderRadius: [10, 10, 0, 0],
              },
            },
            data: this.seriesData[i].slice(1),
            barGap: 0, // 移动柱形的位置
            global: false,
          },

          // 柱状图之间的间距
          // 间距其实就是一个透明的柱条
          {
            name: this.seriesData[i][0],
            tooltip: {
              show: true,
            },
            type: "bar",
            barWidth: 4,
            itemStyle: {
              normal: {
                color: {
                  type: "liner",
                  x: 0,
                  y: 0,
                  x2: 0,
                  y2: 1,
                  global: false,
                  colorStops: [{ offset: 0, color: "rgba(0,0,0,0)" }],
                },
                barBorderRadius: [10, 10, 0, 0],
              },
            },
            data: this.seriesData[i].slice(1),
            barGap: 0, // 移动柱形的位置
            global: false,
          }

]
整个状图组件的代码(直接复制当成组件,按照传参直接使用):
<template>
  <!-- 柱状图组件 -->
  <!--
      传输的参数:
        属性名  |  类型   | 作用
        size: Object 设置柱状图的尺寸
        title: String 设置表格的标题
        showTime: Boolean 控制是否显示右侧的计划停机时间
        xData: Array x轴的轴数据
        seriesData: Array 柱状图的数组,名称+数据 ( 为了适应多组数据的数组,所以使用双层的数组 )比如: [["三中棒", 123, 45, 68]]
        legendData: Array 标签的名称
        seriesColor: Array 柱状图的颜色改变 ( 每个柱子有一个数组控制颜色,注意: 颜色组数与数据的组数相对应,只能多不能少 )
比如: [["rgba(57, 27, 242, 1)","rgba(57, 27, 242, 0.1)","rgba(27, 126, 242, 1)","rgba(27, 126, 242, 0.1)"]]
        seriesImage: Array  柱状图上部icon路径
   -->
  <div>
    <div class="bar_box">
      <!-- 头部标题 -->
      <div class="bar_title">
        <div class="bar_time">
          <p class="bar_name">{{ title }}</p>
          <!-- 这是时间的汇总组件  可以不显示 -->
          <p v-if="showTime"><span>计划停机时间汇总:</span><span>18h</span></p>
        </div>

        <!-- 选择的按钮 -->
        <div class="finished_present">
          <!-- 当日被选中的时候触发 -->
          <p
            class="finished_today"
            @click="changeImage('finished_today')"
            v-if="showButton"
          >
            本周
          </p>
          <p
            class="finished_mouth_no"
            @click="changeImage('finished_mouth')"
            v-if="showButton"
          >
            当月
          </p>

          <!-- 当月被选中的时候触发 -->
          <p
            class="finished_today_no"
            @click="changeImage('finished_today')"
            v-if="!showButton"
          >
            本周
          </p>
          <p
            class="finished_mouth"
            @click="changeImage('finished_mouth')"
            v-if="!showButton"
          >
            当月
          </p>
        </div>
      </div>

      <!-- 柱状图 -->
      <div class="bar_show" ref="bar_show"></div>
    </div>
  </div>
</template>

<script>
import * as echarts from "echarts";
export default {
  name: "barShow",
  mounted() {
    this.showBar();
  },
  data() {
    return {
      showButton: true, // "本周" 选中为 true;  "当月" 选中为 false;
    };
  },
  watch: {
    seriesData: {
      handler(newval, oldval) {
        this.showBar();
      },
      deep: true,
    },
  },
  props: {
    // 设置柱状图的尺寸
    size: {
      type: Object,
      required: false,
      default() {
        return {
          height: 250,
          width: 356,
        };
      },
    },

    // 设置表格的标题
    title: {
      type: String,
      required: false,
      default: "非标产品",
    },

    // 控制是否显示右侧的计划停机时间
    showTime: {
      type: Boolean,
      required: false,
      default: false,
    },

    // x轴的轴数据
    xData: {
      type: Array,
      required: false,
      default() {
        return ["A", "B", "C", "D"];
      },
    },

    // 柱状图的数组
    seriesData: {
      type: Array,
      required: false,
      default() {
        return [["三中棒", 123, 45, 68]];
      },
    },

    // 柱状图的系列颜色
    seriesColor: {
      type: Array,
      require: false,
      default() {
        return [
          [
            "rgba(57, 27, 242, 1)",
            "rgba(57, 27, 242, 0.1)",
            "rgba(27, 126, 242, 1)",
            "rgba(27, 126, 242, 0.1)",
          ],
        ];
      },
    },

    // 柱状图上部icon的图片
    seriesImage: {
      type: Array,
      require: false,
      default() {
        return ["../images/蓝色立方体.png", "../images/紫色立方体.png"];
      },
    },
  },

  methods: {
    // 升级的柱状图
    showBar() {
      const seriseDatas = [];
      // 拆解props的数据,并将serise进行设置
      for (var i = 0; i <= this.seriesData.length - 1; i++) {
        seriseDatas.push(
          // 左侧的渐变柱形
          // 这两个系列为一组,数据多的话需要两个一起循环
          {
            name: this.seriesData[i][0],
            type: "bar",
            showSymbol: false, // 是否显示自定义的图形
            // hoverAnimation: false,
            data: this.seriesData[i].slice(1),
            barWidth: 5, //柱图宽度
            symbol: "diamond",
            global: false,
            // barCategoryGap:'60%',
            itemStyle: {
              //左面
              normal: {
                color: {
                  type: "liner",
                  x: 0,
                  y: 0,
                  x2: 0,
                  y2: 1,
                  global: false,
                  colorStops: [
                    { offset: 0, color: this.seriesColor[i][0] },
                    { offset: 1, color: this.seriesColor[i][1] },
                  ],
                },
                barBorderRadius: [100, 0, 0, 0],
              },
            },
          },

          // 右侧的渐变柱形 以及 头部的定位盒子
          {
            name: this.seriesData[i][0],
            tooltip: {
              show: true,
            },
            type: "bar",
            barWidth: 5,

            label: {
              show: true,
              position: [-6, 3],
              distance: -5,
              formatter: ["{a|}"].join("\n"),
              rich: {
                a: {
                  color: "red",
                  lineHeight: 0,
                  backgroundColor: {
                    image: this.seriesImage[i],
                  },
                  width: 11,
                  height: 11,
                },
              },
            },
            itemStyle: {
              normal: {
                color: {
                  type: "liner",
                  x: 0,
                  y: 0,
                  x2: 0,
                  y2: 1,
                  global: false,
                  colorStops: [
                    { offset: 0, color: this.seriesColor[i][2] },
                    { offset: 1, color: this.seriesColor[i][3] },
                  ],
                },
                barBorderRadius: [10, 10, 0, 0],
              },
            },
            data: this.seriesData[i].slice(1),
            barGap: 0, // 移动柱形的位置
            global: false,
          },

          // 柱状图之间的间距
          {
            name: this.seriesData[i][0],
            tooltip: {
              show: true,
            },
            type: "bar",
            barWidth: 4,
            itemStyle: {
              normal: {
                color: {
                  type: "liner",
                  x: 0,
                  y: 0,
                  x2: 0,
                  y2: 1,
                  global: false,
                  colorStops: [{ offset: 0, color: "rgba(0,0,0,0)" }],
                },
                barBorderRadius: [10, 10, 0, 0],
              },
            },
            data: this.seriesData[i].slice(1),
            barGap: 0, // 移动柱形的位置
            global: false,
          }
        );
      }
      const demo2 = echarts.init(this.$refs.bar_show, null, {
        height: this.size.height,
        width: this.size.width,
      });
      const option = {
        legend: {
          show: true,
          icon: "circle",
        },
        xAxis: {
          // 轴数据由外部传入
          data: this.xData,
          axisLabel: {
            // 名字之间的间距
            interval: 0,
          },
          axisTick: {
            show: false,
          },
        },
        yAxis: {},
        series: seriseDatas,
      };
      option && demo2.setOption(option);
    },

    // 图片的切换
    changeImage(item) {
      if (item == "finished_today") {
        this.showButton = true;
      } else if (item == "finished_mouth") {
        this.showButton = false;
      }
    },
  },
};
</script>
<style lang="scss" scoped>
@mixin name {
  font-size: 22px;
  font-weight: 700;
  line-height: 26px;
  color: rgba(0, 91, 171, 1);
}
@mixin befroeName {
  content: "";
  display: inline-block;
  width: 4px;
  height: 12px;
  background-color: rgba(55, 142, 255, 1);
  margin-right: 8px;
}
.bar_box {
  .bar_title {
    margin-bottom: 8px;
    display: flex;
    justify-content: space-between;
    .bar_name {
      @include name;
    }
    .bar_name::before {
      @include befroeName;
    }

    // 点击的按钮样式
    .finished_present {
      display: flex;
      color: rgba(0, 66, 114, 1);
      @mixin choose {
        width: 84px;
        height: 22px;
        text-align: center;
        line-height: 22px;
      }
      .finished_today {
        @include choose;
        background-image: url("~@/assets/RollSteeling/当前_选中.png");
      }
      .finished_today_no {
        @include choose;
        background-image: url("~@/assets/RollSteeling/当前_未选中.png");
      }
      .finished_mouth {
        @include choose;
        background-image: url("~@/assets/RollSteeling/当前_选中.png");
      }
      .finished_mouth_no {
        @include choose;
        background-image: url("~@/assets/RollSteeling/当前_未选中.png");
      }
    }
  }
  .bar_time {
    @include name;
    font-size: 14px;
  }
}
</style>


 1万+
1万+


 被折叠的 条评论
为什么被折叠?
被折叠的 条评论
为什么被折叠?
 到【灌水乐园】发言


