echarts-柱状图(竖)


hiddenDangerManageEchart(){

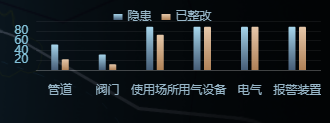
      const name=['管道', '阀门' ,'使用场所' ,'用气设备' ,'电气', '报警装置'],
        data0=[51.8,31.8,88.2,88.2,88.2,88.2],data1=[21.79,11.74,72.1,88.2,88.2,88.2];
      let chartDom2 = document.getElementById("hidden_danger_manage_Echart");
      let myChart2 = echarts.init(chartDom2);
      let option2 = {
        backgroundColor: "",
        tooltip: {
          //提示框组件
          trigger: "axis",
          formatter: "{b}<br />{a0}: {c0}<br />{a1}: {c1}",
          axisPointer: {
            type: "shadow",
            label: {
              backgroundColor: "#6a7985",
            },
          },
          textStyle: {
            color: "#ffb24c",
            fontStyle: "normal",
            fontFamily: "微软雅黑",
            fontSize: 12,
          },
        },
        legend: {
          data: ["隐患", "已整改"],
          icon: "react",
          top: "3%",
          itemWidth: 9,
          itemHeight: 6,
          textStyle: {
            color: '#98B7C9',
            fontSize: 12,
          },

        },
        grid: {
          left: "1%",
          right: "0%",
          bottom: "6%",
          top: '18%',
          padding: "0 0 10 0",
          containLabel: true,
        },
        xAxis: [
          {
            type: "category",
            boundaryGap: true, //坐标轴两边留白
            data: name,
            axisLabel: {
              //坐标轴刻度标签的相关设置。
              interval: 0, //设置为 1,表示『隔一个标签显示一个标签』
              margin: 15,
              textStyle: {
                color: "#98B7C9",
                fontStyle: "normal",
                fontFamily: "微软雅黑",
                fontSize: 12,
              },
            },
            axisTick: {
              //坐标轴刻度相关设置。
              show: false,
            },
            axisLine: {
              //坐标轴轴线相关设置
              lineStyle: {
                color: "#fff",
                opacity: 0.2,
              },
            },
            splitLine: {
              //坐标轴在 grid 区域中的分隔线。
              show: false,
            },
          },
        ],
        yAxis: [
          {
            type: "value",
            splitNumber: 5,
            axisLabel: {
              textStyle: {
                color: '#83C3DB',
                fontStyle: "normal",
                fontFamily: "微软雅黑",
                fontSize: 12,
              },
            },
            axisLine: {
              show: false,
            },
            axisTick: {
              show: false,
            },
            splitLine: {
              show: true,
              lineStyle: {
                color: ["#fff"],
                opacity: 0.06,
              },
            },
          },
        ],
        series: [
          {
            name: "隐患",
            type: "bar",
            data: data0,
            barWidth: 7,
            barGap: 0, //柱间距离
            label: {
              //图形上的文本标签
              normal: {
                show: false,
                position: "top",
                textStyle: {
                  color: "#fefefe",
                  fontStyle: "normal",
                  fontFamily: "微软雅黑",
                  fontSize: 12,
                },
              },
            },
            itemStyle: {
              //图形样式
              normal: {
                barBorderRadius: [1, 1, 0, 0],
                color: new echarts.graphic.LinearGradient(
                  0,
                  0,
                  0,
                  1,
                  [
                    {
                      offset: 1,
                      color: "rgba(78,103,131,0.9)",
                    },
                    {
                      offset: 0,
                      color: "rgb(167,214,236)",
                    },
                  ],
                  false
                ),
              },
            },
          },
          {
            name: "已整改",
            type: "bar",
            data: data1,
            barWidth: 7,
            barGap:0.5, //柱间距离
            label: {
              //图形上的文本标签
              normal: {
                show: false,
                position: "top",
                textStyle: {
                  color: "#fefefe",
                  fontStyle: "normal",
                  fontFamily: "微软雅黑",
                  fontSize: 12,
                },
              },
            },
            itemStyle: {
              //图形样式
              normal: {
                barBorderRadius: [1, 1, 0, 0],
                color: new echarts.graphic.LinearGradient(
                  0,
                  0,
                  0,
                  1,
                  [
                    {
                      offset: 1,
                      color: "rgba(195,143,96,0.9)",
                    },
                    {
                      offset: 0,
                      color: "rgba(254,220,187,0.9)",
                    },
                  ],
                  false
                ),
              },
            },
          },
        ],
      };

      option2 && myChart2.setOption(option2);
      this.echartsEntityArr.push(myChart2);
    },

 nonOperatingEcharts(operationData){
        let chartDom = document.getElementById("nonOperatingEcharts");
        let myChart = echarts.init(chartDom);
       let option = {

          tooltip: {
            trigger: 'axis',
            axisPointer: {
              type: 'shadow'
            }
          },

          grid: {
            top: '10%',
            left: '5%',
            right: '5%',
            bottom: '15%',
            containLabel: true
          },
          xAxis: [{
            type: 'category',
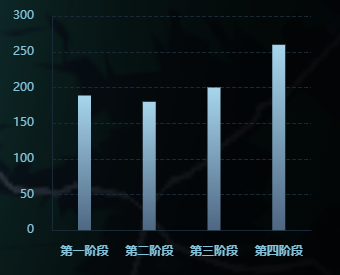
            data: ['第一阶段', '第二阶段', '第三阶段', '第四阶段'],
            axisTick: {
              show: false,//刻度
            },
            splitLine: {
              show: false,
            },
            axisLine: {
              show: true,
              lineStyle:{
                color: "#192935"
              },
            },

            axisLabel: {
              color: '#83C3DB',
              fontSize: 12,
              fontWeight: 600,
              interval: 0,
              padding: [8, 0, 0, 0]
            },
          }],
          yAxis: [{
            type: 'value',
            name: '',
            nameTextStyle: {
              color: "#83C3DB",
              fontSize: 12,
              padding: [0, 0, 6, -60],
            },
            axisLabel: {
              show: true,
              textStyle: {
                color: '#83C3DB',

              },
              padding: 10
            },
            axisLine: {
              show: true,
              lineStyle:{
                color: "#192935"
              },
            },
            splitLine :{    //网格线
              lineStyle:{
                type:'dashed',    //设置网格线类型 dotted:虚线   solid:实线
                color: "#192935"
              },

              show:true //隐藏或显示
            }


          }],
          series: [{
            name: '非经营类分析',
            type: 'bar',
            emphasis: {
              focus: 'series'
            },
            barWidth: 13,
            label: {
              normal: {
                show: false,
                position: "top",
                formatter: function (data) {
                  return '{a0|' + data.value + '}';
                },
                rich: {
                  a0: {
                    color: '#5470c6',
                    fontSize: 12,
                    fontFamily: 'DIN',
                    fontWeight: 'bold'
                  },
                }
              },
            },
            itemStyle: {
              color:new echarts.graphic.LinearGradient(
                0,
                1,
                0,
                0,
                [
                  {
                    offset: 0,
                    color: '#4E6783',
                  },
                  {
                    offset: 1,
                    color: '#A7D6EC',
                  },
                ],
                false
              ),
            },
            //188.82, 180, 200, 260
            data: [{
              value: 188.82,
              label: {
                show: false
              }
            },
              {
                value: 180,
                label: {
                  show: false
                }
              }, {
                value: 200,
                label: {
                  show: false
                }
              },
              {
                value: 260,
                label: {
                  show: false
                }
              }
            ]
          },]
        };

        option && myChart.setOption(option);
        this.echartsEntityArr.push(myChart);

      },
  • 0
    点赞
  • 0
    收藏
    觉得还不错? 一键收藏
  • 0
    评论

“相关推荐”对你有帮助么?

  • 非常没帮助
  • 没帮助
  • 一般
  • 有帮助
  • 非常有帮助
提交
评论
添加红包

请填写红包祝福语或标题

红包个数最小为10个

红包金额最低5元

当前余额3.43前往充值 >
需支付:10.00
成就一亿技术人!
领取后你会自动成为博主和红包主的粉丝 规则
hope_wisdom
发出的红包
实付
使用余额支付
点击重新获取
扫码支付
钱包余额 0

抵扣说明:

1.余额是钱包充值的虚拟货币,按照1:1的比例进行支付金额的抵扣。
2.余额无法直接购买下载,可以购买VIP、付费专栏及课程。

余额充值