from plotnine import *
import pandas as pd

# 准备数据
df = pd.DataFrame({'weight': [130, 140, 155],
                   'height': [160, 165, 170]})
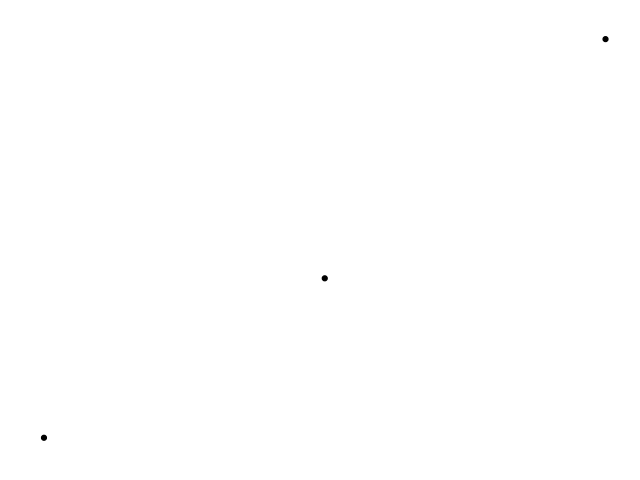
print(ggplot(df)+
         geom_point(aes(y='weight',
                        x='height'))+
         theme_void()) # 无背景和坐标轴,只显示数据点。
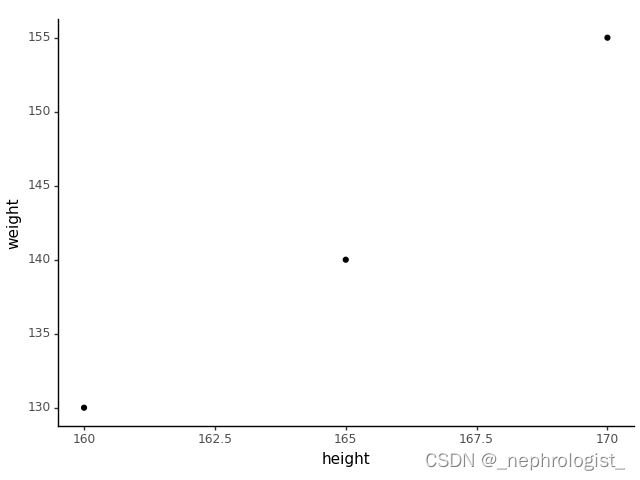
print(ggplot(df)+
         geom_point(aes(y='weight',
                        x='height'))+
         theme_classic()) # 无背景,显示坐标轴和数据点。
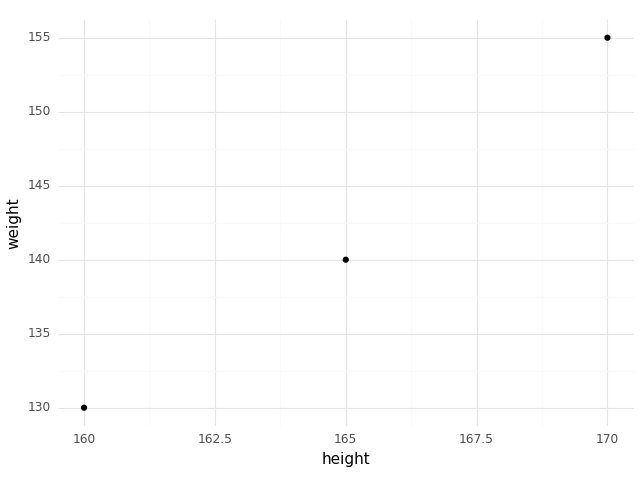
print(ggplot(df)+
         geom_point(aes(y='weight',
                        x='height'))+
         theme_light()) # 明亮背景
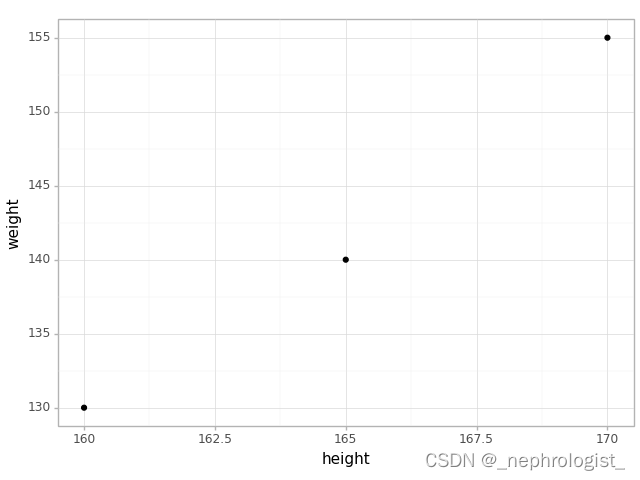
print(ggplot(df)+
         geom_point(aes(y='weight',
                        x='height'))+
         theme_minimal()) # 白色背景
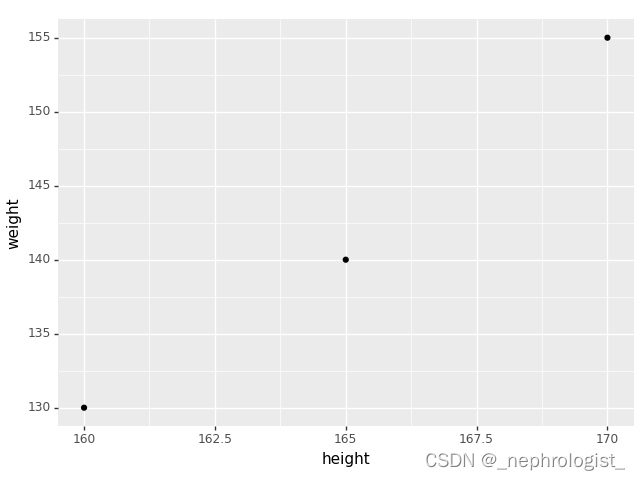
print(ggplot(df)+
         geom_point(aes(y='weight',
                        x='height'))+
         theme_gray()) # 灰色背景
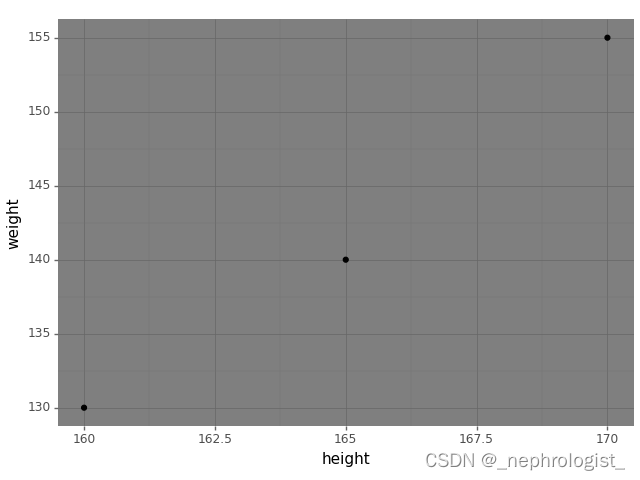
print(ggplot(df)+
         geom_point(aes(y='weight',
                        x='height'))+
         theme_dark()) # 暗色背景


 4110
4110

 被折叠的 条评论
为什么被折叠?
被折叠的 条评论
为什么被折叠?
 到【灌水乐园】发言


