


目 录
最近在学习pyechart,老师要我们画几个简单的图,比如折线图,柱状图,饼状图,我这里在参考pyechart文档之后,自己封装了一下,可能依旧有点丑陋,也欢迎各位老爷们指正!
参考文档:简介 - pyecharts - A Python Echarts Plotting Library built with love.
环境说明:python 3.7.0 使用的为V2版本的pyechart
一、项目结构
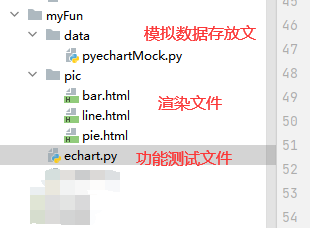
二、文件封装
请注意替换实际的项目相对路径
2.1echart.py
from pyecharts.charts import Bar,Line,Pie  # 画条形图,折线图,饼图
from pyecharts import options as op
# 下载图片的工具函数
from snapshot_selenium import snapshot
# 生成图片的函数
from pyecharts.render import make_snapshot
# 饼状图需要模拟数据
from pyecharts.faker import Faker
# 导入mock数据
from 实验报告文档.实验代码.lab4.myFun.data.pyechartMock import *


# 获取图片 传入bar对象和 文件路径
def generatePic(bar,filePath):
    make_snapshot(snapshot,bar.render(),filePath)

# 画柱状图
# 1.传入一个横坐标,
# 2.传入一个包含y轴数据的字典,里面包含多个种类的数据
# 3.传入一个标题对象 里面包含标题和副标题
# 4.html生成的路径
def drawBar(xLabelList,yLabelDict,titleDict,targetPath):
    bar = Bar()
    bar.add_xaxis(xLabelList)
    for k,v in yLabelDict.items():
        bar.add_yaxis(k,v)
    bar.set_global_opts(title_opts=op.TitleOpts(title=titleDict['title'],subtitle=titleDict['subTitle']))
    bar.render(targetPath) # 渲染 生成html
    # generatePic(bar,filePath) # 要画很久 性能不行!!!

# 画折线图
# 1.传入一个横坐标内容列表  week_name_list
# 2.传入一个数据字典 dataDict  里面包含多个对象 每个对象包含一个name 一个itemYLabelList
# 3.传入title对象
# 4.传入是否显示工具选项
def drawLine(xLabelList,yLabelDict,titleDict,targetPath,showTools):
    line = Line()
    line.add_xaxis(xaxis_data=xLabelList)
    for k,v in yLabelDict.items():
        line.add_yaxis(
            series_name=k,
            y_axis=v,
            markpoint_opts=op.MarkPointOpts(
                data=[
                    # op.MarkPointItem(type_="max", name="最大值"), # 标记最大值点
                    # op.MarkPointItem(type_="min", name="最小值"), # 标记最小值点
                ]
            ),
            markline_opts=op.MarkLineOpts(
                data=[
                    # op.MarkLineItem(symbol="circle", type_="max", name="最高点"),  # 标记最高值线
                    # op.MarkLineItem(type_="average", name="平均值"),               # 标记均值线
                    # op.MarkLineItem(symbol="circle", type_="min", name="最低点"),  # 标记最低值线
                ]
            ),
        )
    line.set_global_opts(
            title_opts=op.TitleOpts(title=titleDict['title'], subtitle=titleDict['subTitle']),
            tooltip_opts=op.TooltipOpts(trigger="axis"),
            toolbox_opts=op.ToolboxOpts(is_show=showTools), # 这里设置是否显示下载等工具
            xaxis_opts=op.AxisOpts(type_="category", boundary_gap=False),
        )
    line.render(targetPath)

# 画饼状图
# 1.一个名字列表
# 2.一个值列表
# 3.一个颜色列表
# 4.一个文件生成路径
# 5.一个标题对象
def drawPine(nameList,valueList,colorList,titleDict,targetPath):
    pie = Pie()
    pie.add("",[list(z) for z in zip(nameList,valueList)])
    pie.set_colors(colorList)
    pie.set_global_opts(title_opts=op.TitleOpts(title=titleDict['title']))
    pie.set_series_opts(label_opts=op.LabelOpts(formatter="{b}: {c}"))
    pie.render(targetPath)


# 因为是给./data/pyechartMock调用的,所以写../ (x) 这种想法是错误的!!!
# import 就相当于将函数定义在当前文件了!!!
barFilePath = r'./pic/bar.html'
lineFilePath = r'./pic/line.html'
pieFilePath = r'./pic/pie.html'

# pyechart unit testing
if __name__ == '__main__':
    print("主函数运行成功!")
    # 测试bar图像
    drawBar(BarList,BarDict,BarTitle,barFilePath)
    drawLine(LineList,LineDict,LineTitle,lineFilePath,showTools=True)
    drawPine(PieNameList,PieValueList,PieColorList,PieTitle,pieFilePath)
    # drawPine(pieFilePath)
2.2pyechartMock.py
import random

LISTNUM = 10    # x轴种类
DICTNUM = 5     # y轴种类
BarList = ['物品'+str(i) for i in range(LISTNUM)]
BarDict = dict()

BarTitle = {
    'title':'这是柱状图的主标题',
    'subTitle': '这是柱状图的副标题',
}
# 0 -> A
def numToAlph(num):
    return chr(num+65)
# A -> 0
def alphToNum(ch):
    return ord(ch)-65

for i in range(DICTNUM):
    BarDict['商家'+str(numToAlph(i))] = [random.randint(10,100) for i in range(LISTNUM)]

################################################
LineList = ['星期'+str(i) for i in range(LISTNUM)]
LineDict = dict()

LineTitle = {
    'title':"这是折线图的主标题",
    'subTitle': '这是折线图的副标题',
}

for i in range(DICTNUM):
    LineDict["种类"+str(numToAlph(i))] = [random.randint(10,100) for i in range(LISTNUM)]

################################################
PieNameList = ['名字'+str(i) for i in range(LISTNUM)]
PieValueList = [random.randint(10,90)//10 for i in range(LISTNUM)]
PieColorList = ["blue", "green", "yellow", "red", "pink", "orange", "purple"]

PieTitle = {
    'title':"这是饼状图的主标题",
    'subTitle': '这是饼状图的副标题',
}
三、结果
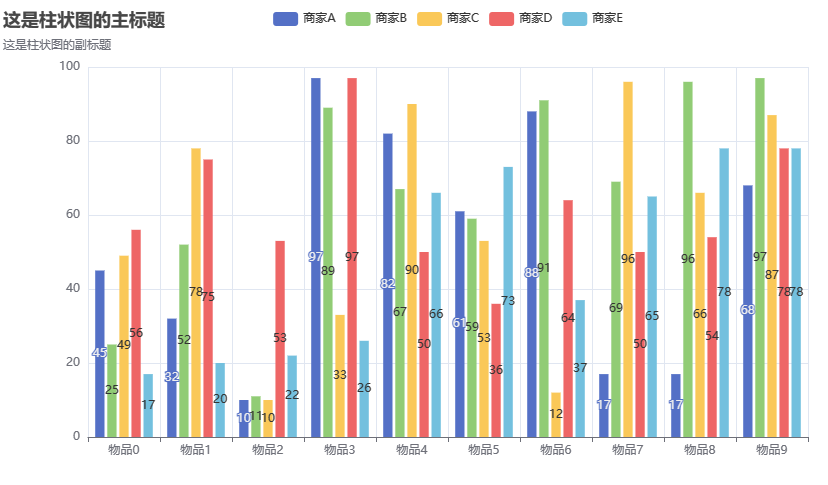
3.1柱状图
3.2折线图

3.3饼状图
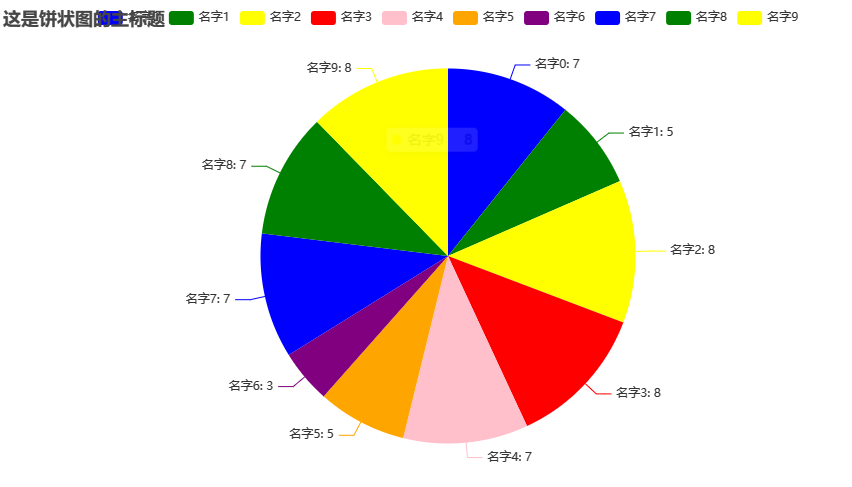
这样,当你想用啥的时候,也可以自己mock模拟一些数据,丢到这个函数里面,非常方便!


 349
349


 被折叠的 条评论
为什么被折叠?
被折叠的 条评论
为什么被折叠?
 到【灌水乐园】发言


