


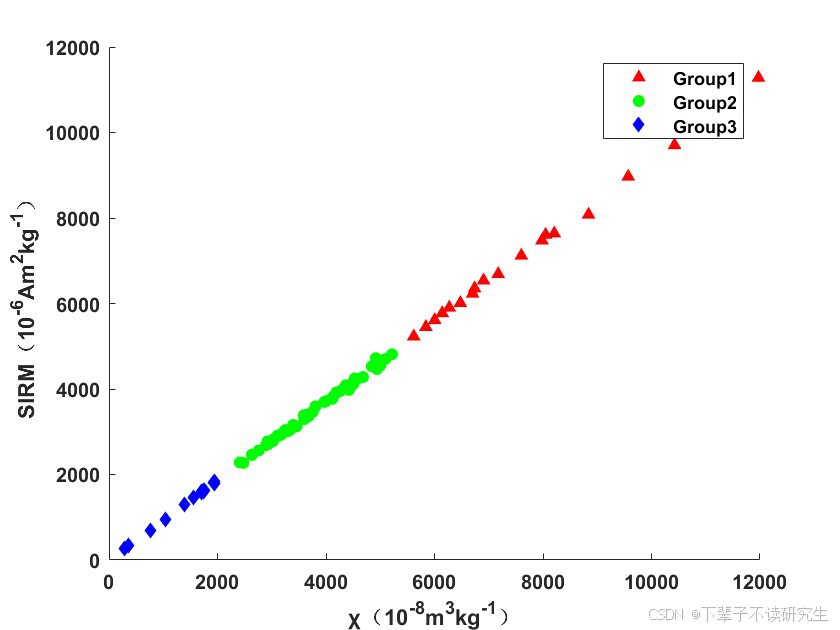
这个是上一个帖子的升级版,画完散点图之后导师让我根据分组结果重新绘制,我就将分组好的数据分别放置在同一个excel文件的不同表格中来进行绘制
下面是结果图
num= xlsread('C:\Users\24868\Desktop\jzredodata\zscatter.xlsx','sheet1');  % 读取数据
a=num(:,2);%x坐标选取excel表格中哪一列
b=num(:,3);%y坐标选取excel表格中哪一列
scatter(a,b, 'filled',  'r^');
hold on
num1= xlsread('C:\Users\24868\Desktop\jzredodata\zscatter.xlsx','sheet2');
d=num1(:,3);
scatter(c,d, 'filled',  'go');
hold on
num2= xlsread('C:\Users\24868\Desktop\jzredodata\zscatter.xlsx','sheet3');
e=num2(:,2);
f=num2(:,3);
scatter(e,f, 'filled', 'bd');
% 添加标题和标签
%title(' χ and SIRM', 'FontSize', 14, 'FontWeight', 'bold');
xlabel('χ(10^-^8m^3kg^-^1)', 'FontSize', 12, 'FontWeight', 'bold');
ylabel('SIRM(10^-^6Am^2kg^-^1)', 'FontSize', 12, 'FontWeight', 'bold');%'SIRM(10^-^6Am^2kg^-^1)',S_-_1_0_0(%),χ_A_R_M(10^-^8m^3kg^-^1)
legend('Group1','Group2','Group3')
% 设置图形属性
ax = gca;
ax.FontSize = 10;
ax.FontWeight = 'bold';
ax.GridAlpha = 0.3;
ax.GridLineStyle = ':';

box off;


 3万+
3万+

 被折叠的 条评论
为什么被折叠?
被折叠的 条评论
为什么被折叠?
 到【灌水乐园】发言


